Research: Bitcoin weathers macro headwinds as Dow Jones sinks
Volatility analysis reveals Bitcoin holding firm in contrast to the Dow Jones, which is now more volatile than the leading cryptocurrency.

Cover art/illustration via CryptoSlate. Image includes combined content which may include the use of AI tools.
Since mid-September, Bitcoin has been “crabbing,” or moving sideways, between $18,100 and $20,500.
The noticeably flat price action has given rise to remarks such as BTC is dead and forex trading is the new crypto trading.
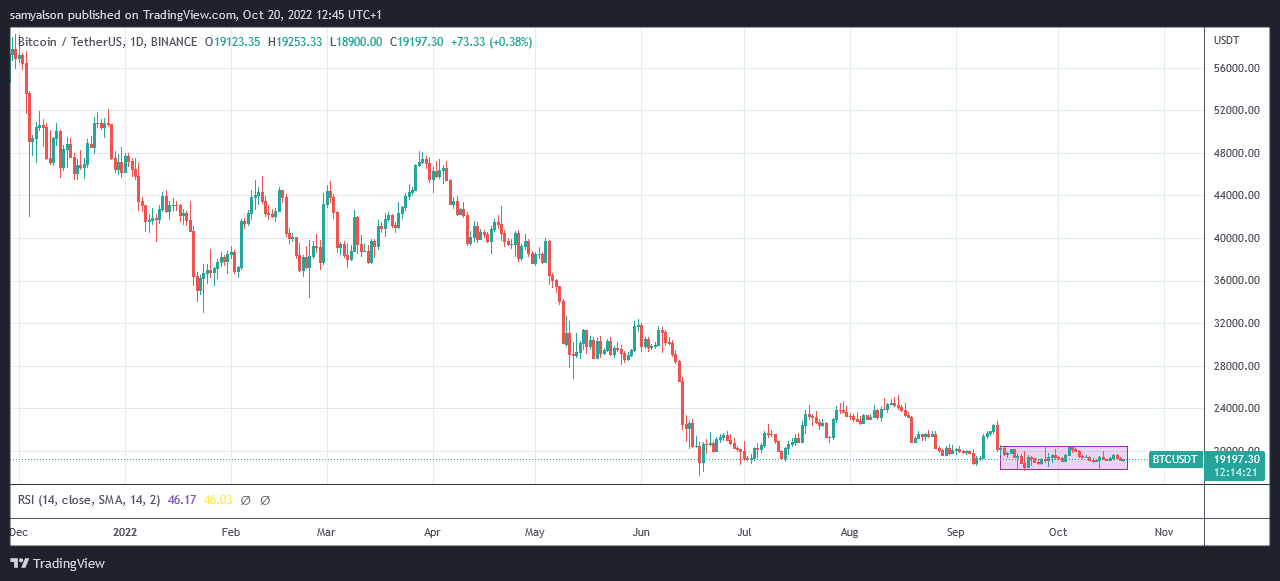
However, taking into consideration the deteriorating macroeconomic environment, a different narrative might be that Bitcoin volatility has eased during these testing times.
What's more, this is something that Wall Street would have picked up on.
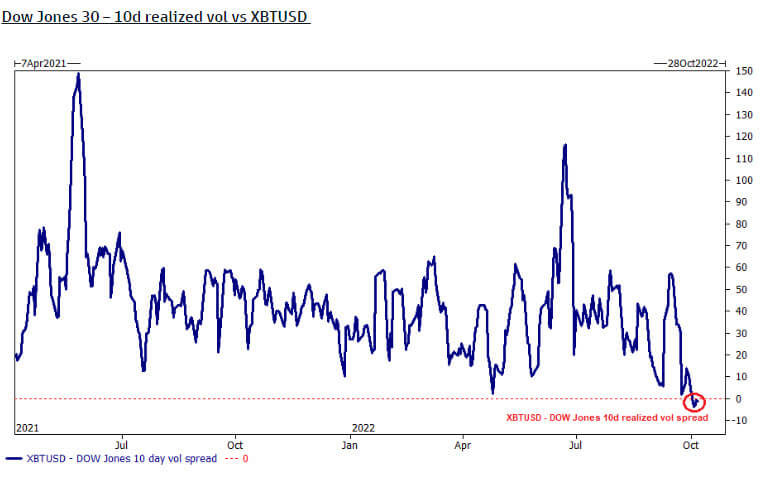
Dow Jones volatility
The chart below maps the ten-day realized volatility spread between the 30 largest industrial stocks against Bitcoin.
Since October, as BTC has remained relatively flat in dollar terms, this metric has dipped below zero, indicating that the Dow Jones is now more volatile than Bitcoin.
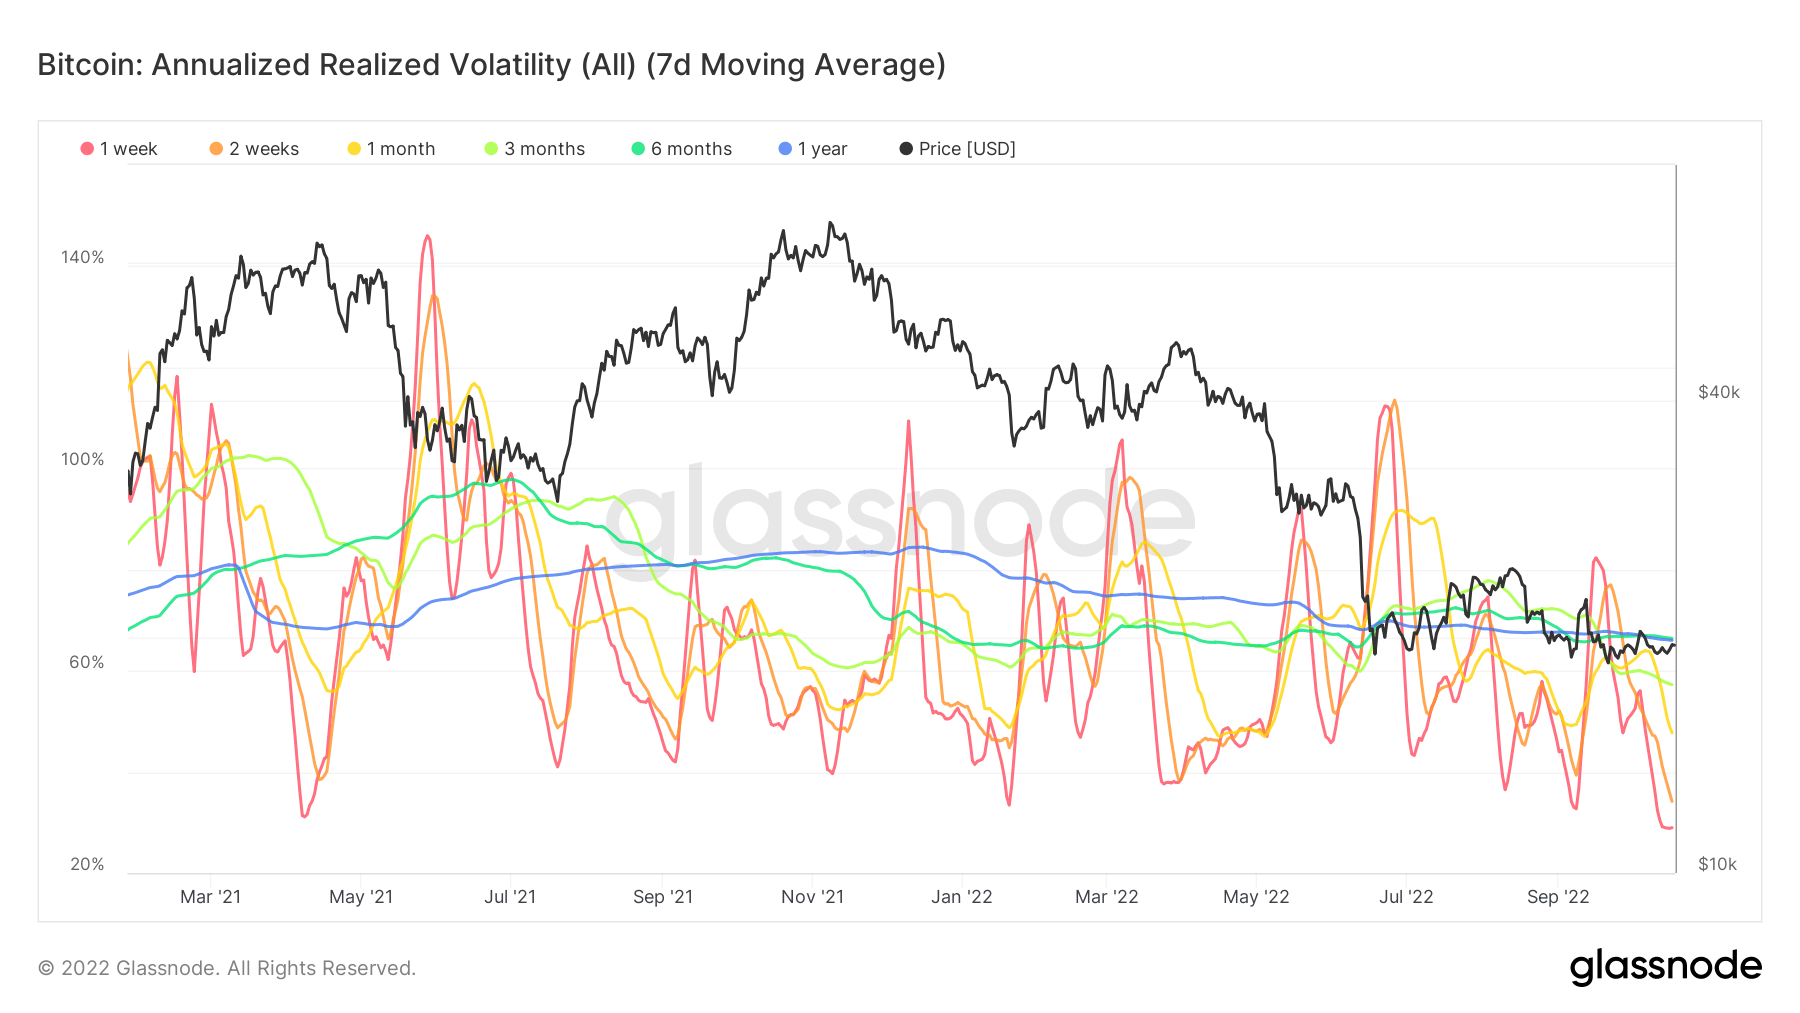
Bitcoin Annualized Realized Volatility
Bitcoin Annualized Realized Volatility refers to actual volatility movements in the BTC options market based on defined past periods.
Annualizing the data assumes observations made over a particular time frame, in this case, over one week, two weeks, one month, three months, and six months, will continue over the course of a year.
The chart below shows that realized volatility is at an all-time low, with all time frames currently below the one-year line.
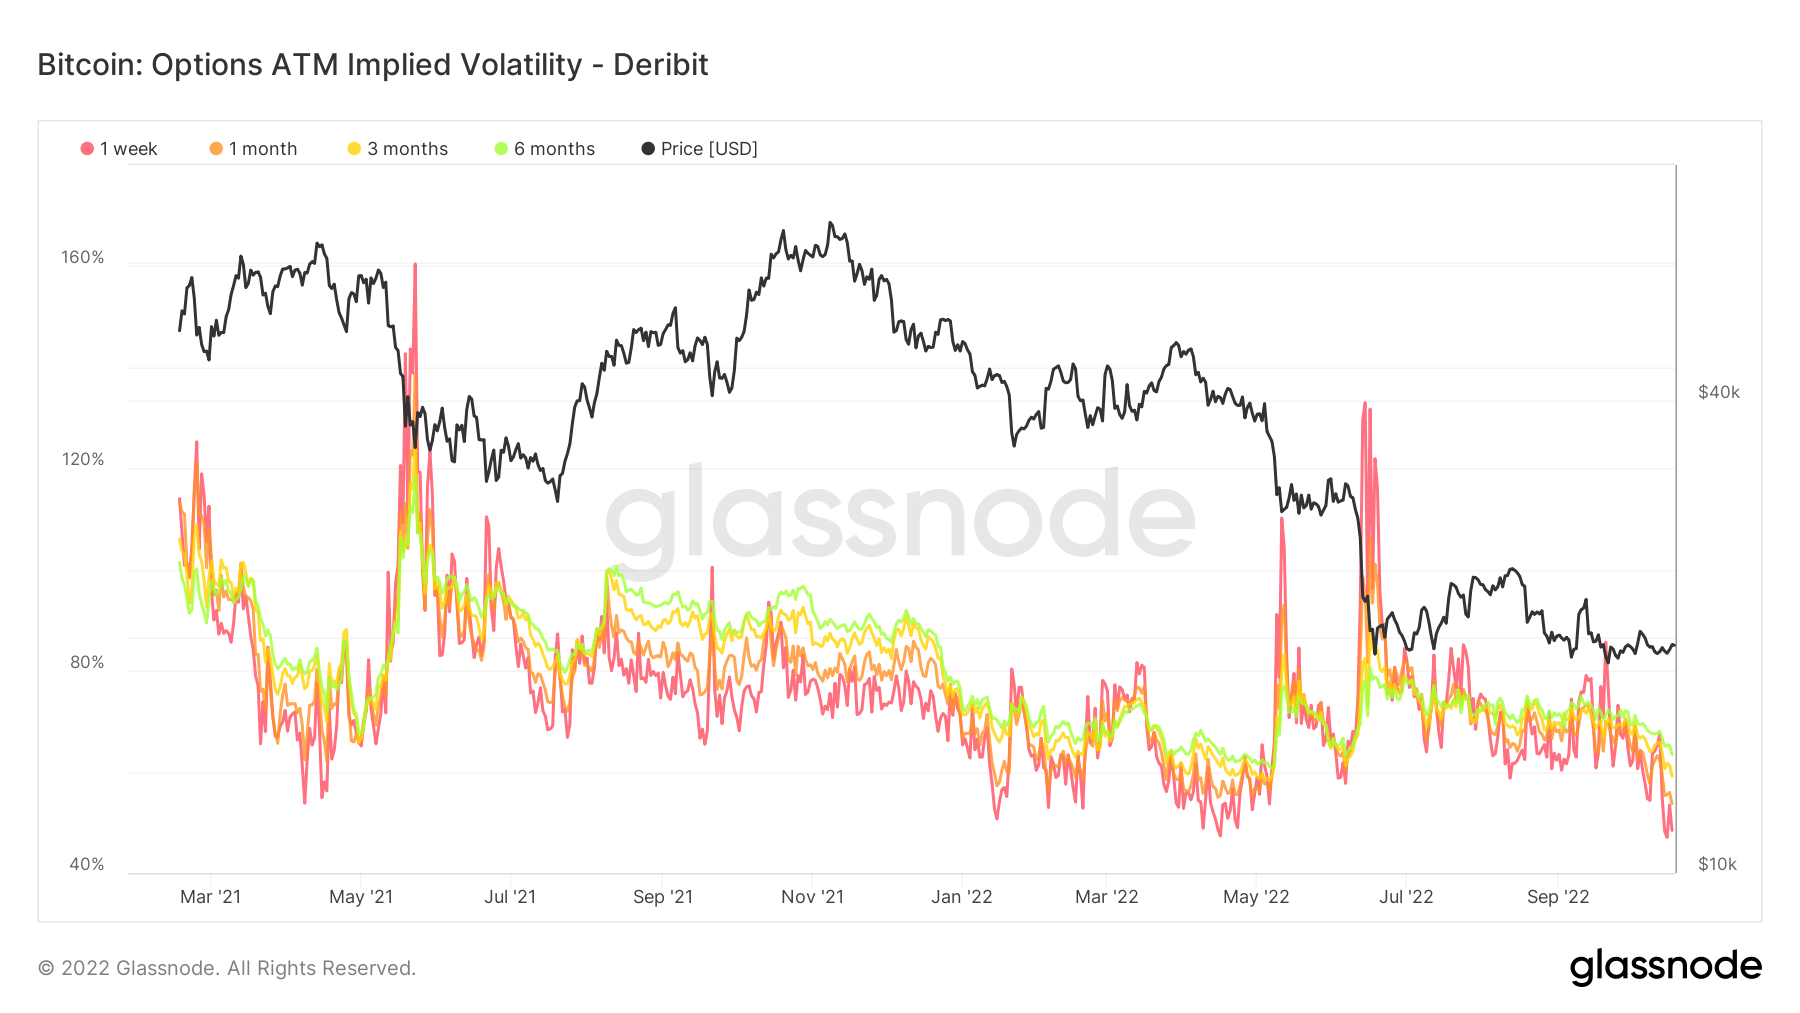
BTC Options ATM Implied Volatility
Realized volatility refers to the market's assessment of past volatility measures, whereas Implied volatility is in relation to future volatility. Implied volatility generally increases during bearish markets and decreases when the market is bullish.
The chart below shows all time frames for implied volatility trending downwards since late July. Currently, each of the four periods has sunk below 55%, which is encouraging for bulls.