Chainlink‘s parabolic uptrend in question despite signs of fundamental strength

Photo by SpaceX on Unsplash
Chainlink’s immense strength seen throughout the past couple of years may soon come to a conclusion.
This grim possibility is rooted in the fact that it is fast approaching the end of a parabolic trendline that has been guiding its immense uptrend seen since 2019.
One analyst is now noting that he is anticipating LINK to see a notable decline in the near-term before it enters an accumulation range. He believes that this phase will be followed by further upside.
On-chain data does point to underlying strength, however, as the balance on Chainlink within exchange wallets has been caught within an unrelenting downtrend in recent times. This is a sign that investors are taking a long-term approach towards their LINK positions.
Chainlink nears end of massive parabolic growth curve
Chainlink has been guided higher by a massive parabolic growth curve for over 900 days, and each reaction to this level has been potent.
Recently, CryptoSlate reported that one analyst believes that another visit to this trendline could provide the bullish cryptocurrency with a major boost higher – especially against its Bitcoin trading pair.
That being said, other traders are now offering a slightly different perspective, noting that although it could guide LINK higher for a short while longer, it is beginning to run out of room.
One trader who goes by the name “Pentoshi” mused this possibility in a recent tweet, explaining that he believes Chainlink’s BTC price will dive from 0.000433 to 0.000245 in the months ahead.
“LINK: 915 Day parabola potentially approaching it's end… All market cycles come to an end before new beginnings. Re-accumulation lower before the next rallies imo.”
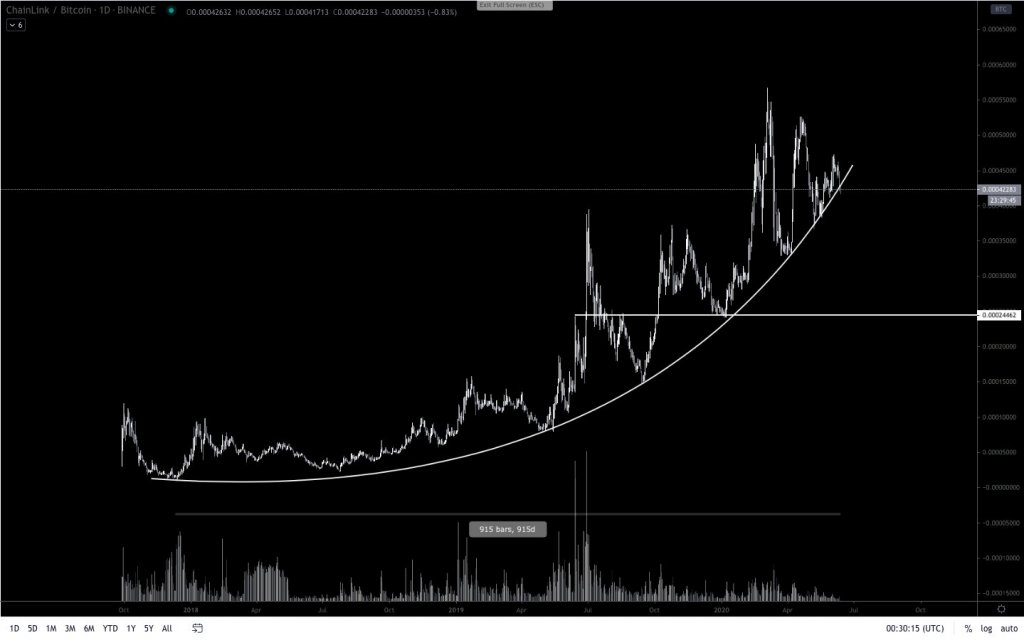
The potential decline to this level would essentially only erase the gains LINK has posted since the start of 2020.
LINK’s on-chain data paints a bullish picture
There is one key on-chain metric that seems to indicate that LINK’s bears may have trouble catalyzing any type of sharp downside movement.
According to data from analytics firm Glassnode, the balance of Chainlink within exchange wallets has just reached a one-year low.
“LINK Balance on Exchanges (1d MA) just reached a 1-year low of 73,040,792.488 LINK. Previous 1-year low of 73,056,325.453 LINK was observed on 13 June 2020.”
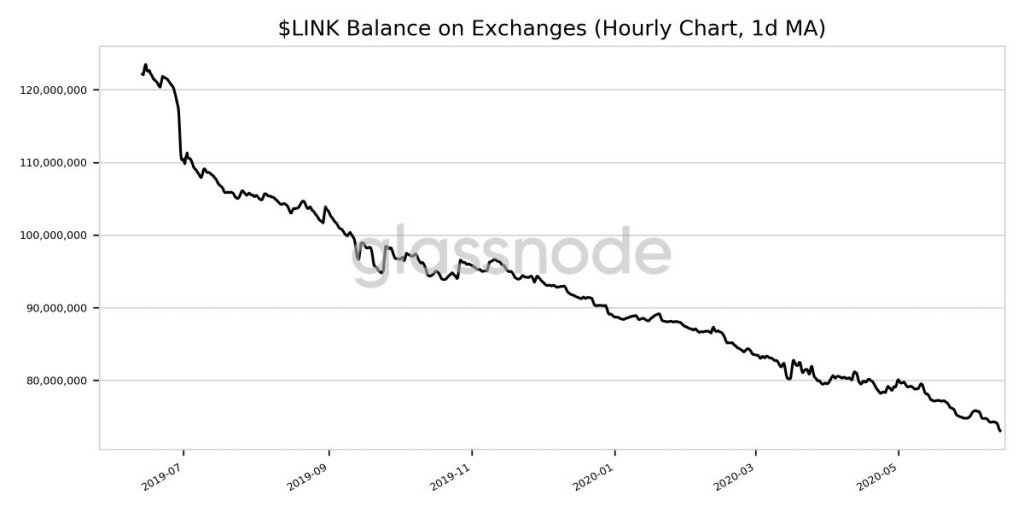
The chart seen below shows that the trend of investors fleeing exchanges in favor of holding their tokens in cold storage has been ongoing over the past year.
This indicates that these market participants are taking a long-term approach to their Chainlink investments, signaling that it may not face any heavy selling pressure until it reaches significantly higher prices.