JPMorgan: Bitcoin is trading above fair value. What does this indicate?
Analysis by JPMorgan and Glassnode give contradictory fair value assessments. But in both cases, the outlook is possibly bearish.

Cover art/illustration via CryptoSlate. Image includes combined content which may include the use of AI tools.
Investment bank JPMorgan has calculated Bitcoin's fair value at $38,000. This figure is 12% less than the actual price at the time, indicating overvaluation and suggesting a possible price drop to come.
On-chain analysis conducted by Glassnode shows an undervaluation in relation to the 200-day moving average. While contradictory to JPMorgan's assessment, historical occurrences of this pattern support price drawdowns and capitulation events.
In short, despite opposing views on fair value assessment, both entities suggest a possible bearish outlook.
How did JPMorgan come up with its assessment?
JPMorgan strategists headed by Nikolaos Panigirtzoglou worked out Bitcoin's fair value based on its volatility against gold.
Detailed calculations were not included in the Bloomberg piece. However, they state that the $38,000 fair value figure is derived from Bitcoin being approximately four times as volatile as gold.
Typically, when an asset is trading above its fair value, it will likely underperform and eventually revert down to its fair value price.
However, JPMorgan conceded this assessment is highly dynamic. Adding that a narrowing volatility differential, to three times that of gold, will increase $BTC's fair value to $50,000.
The team said January's price correction is looking less of a capitulation event compared to May 2021's “crypto crash.” But futures open interest and exchange reserves point to a “worrisome position reduction trend.”
Bitcoin Mayer Multiple analysis
The latest Glassnode newsletter performed extensive on-chain analysis to evaluate whether the Bitcoin bottom is in.
Although the report charted and assessed a wide range of metrics, the most relevant metric for examining under/overvaluation is the Mayer Multiple (MM).
The MM is calculated by dividing the Bitcoin price by the 200-day moving average. The 200-day moving average is widely agreed as a long-term bull or bear indicator. Deviations below it suggest a degree of undervaluation relative to the long-term mean.
According to Glassnode, the MM is currently trading at 0.8, or 20% below the 200-day moving average, indicating undervaluation against the long-term mean.
“The Mayer Multiple traded below 0.8 this week, representing a 20%+ discount relative to the 200DMA. The price level representing a Mayer Multiple of 0.8 is $39.1k”
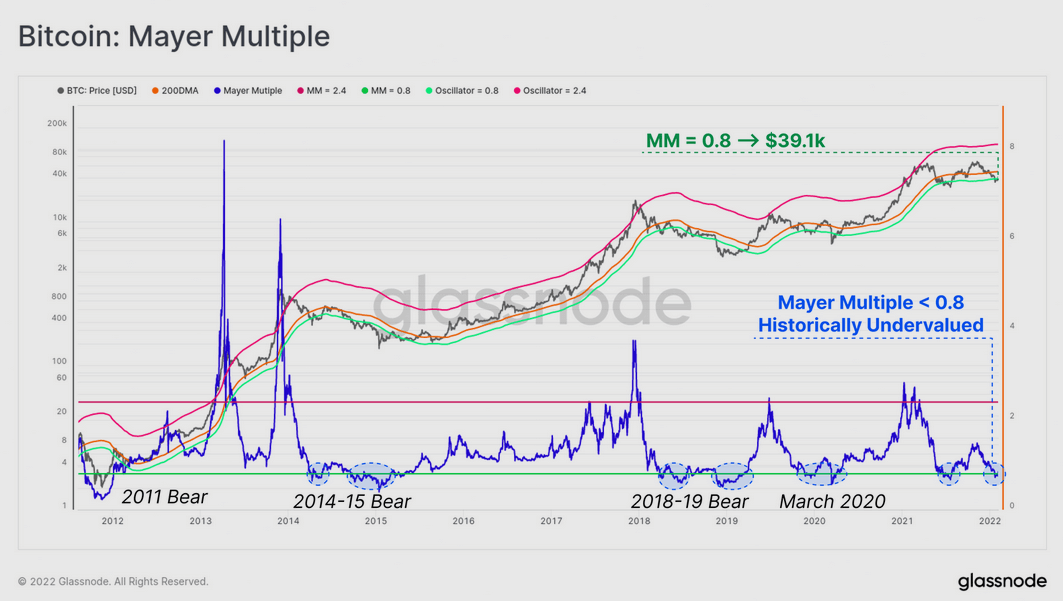
As pointed out by Glassnode, historical instances of the MM trading at 0.8 or below usually correlate with severe drawdowns in bear markets.
The chart above supports this view, with the exceptions being January and March 2020, where the MM dipped below 0.8, yet these periods are not classed as bear markets.
Using other metrics, Glassnode says there is a reasonable degree of momentum behind this rally. But they express caution over long-term holders cashing out and whether renewed demand will arrive.
The contradictory assessments of over/undervaluation come from the use of different benchmarks. In JPMorgan's case, they used the actual price as a benchmark. Whereas Glassnode used the 200-day moving average.