


Up, down, or sideways? Ethereum Classic, Ontology, OmiseGo, Augur, 0x technical analysis

Cover art/illustration via CryptoSlate. Image includes combined content which may include the use of AI tools.
Yesterday’s wild price action—where bitcoin saw its value jump above $9,000 to then quickly drop to $8,000—has the market wondering whether the bullish trend will continue or if it is time for a correction. Even though it seems like it is time to stay off the market, technical analysis of some of the most prominent altcoins could indicate otherwise.
Ethereum Classic
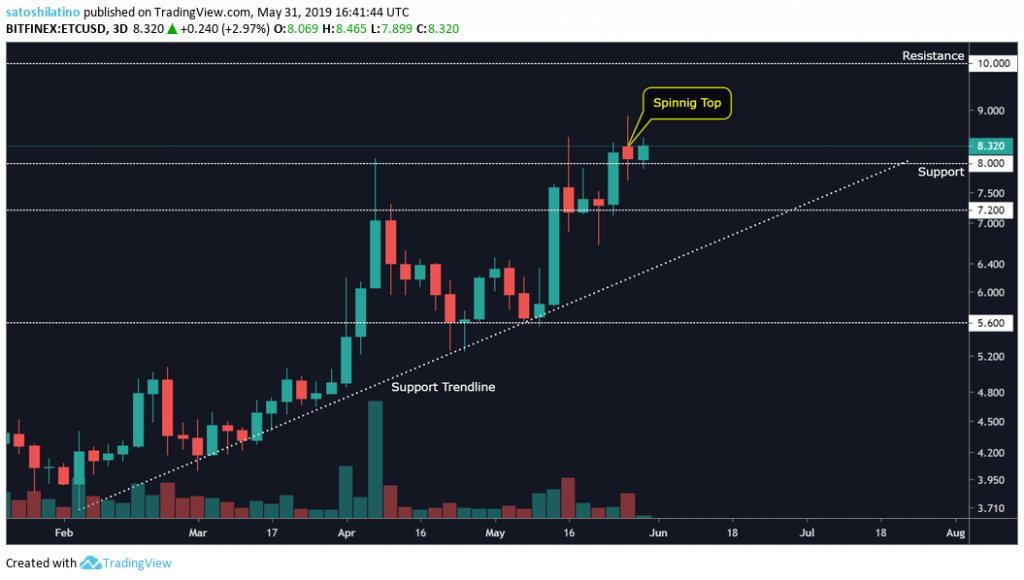
Since Feb. 6 ethereum classic has experienced a steady increase in its market valuation to reach a high of $8.9 on May 30, which represents a 141 percent gain from a low of $3.7.
On the 3-day chart, a spinning top candlestick formed indicating that a correction may come. If ETC retraces, it could try to test the $7.2 level, the support trendline or even the major support given by the $5.6 price point.
However, if the $8 support level where ETC is trading now is able to hold its price, it could continue to rise and try to test the $10 resistance level.
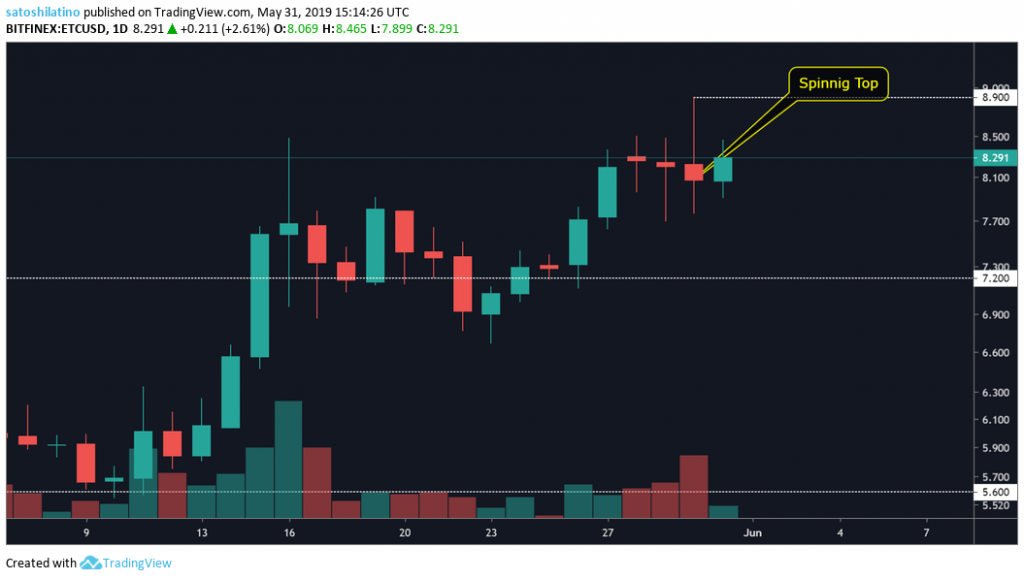
A spinning top candlestick can also be seen on the 1-day chart predicting a pullback that could take ETC to $7.2. The bearish pattern will be invalidated if this cryptocurrency is able to trade above the recent high of $8.9.
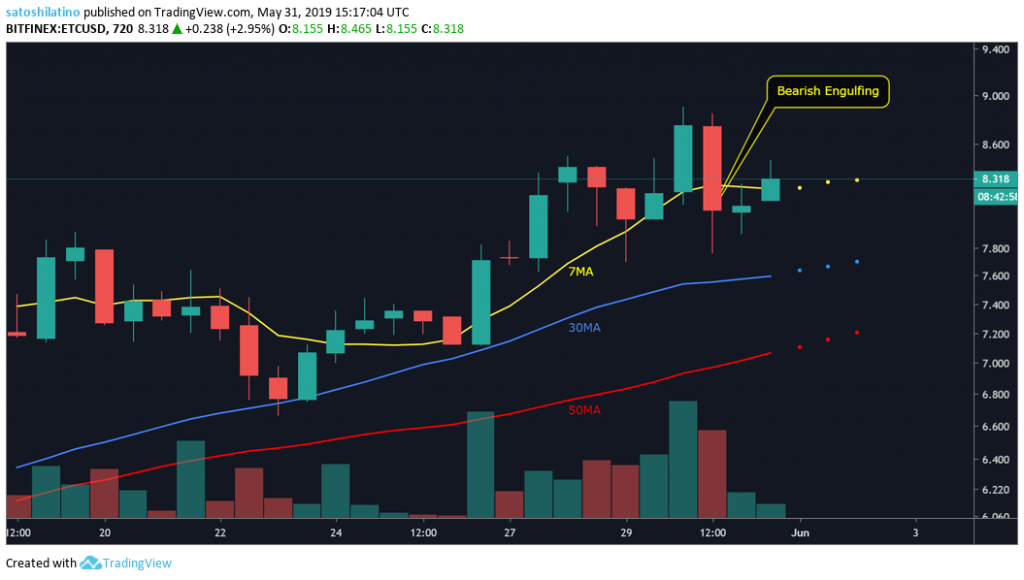
 A bearish engulfing candlestick formed on the 12-hour chart. At the moment, ethereum classic is trading above the 7 MA which is a bullish sign, but if the bearish formation is validated this cryptocurrency could go down to test the 30 or 50 MA. It will be wiser to wait for a move above the previous high before entering a bullish trade.
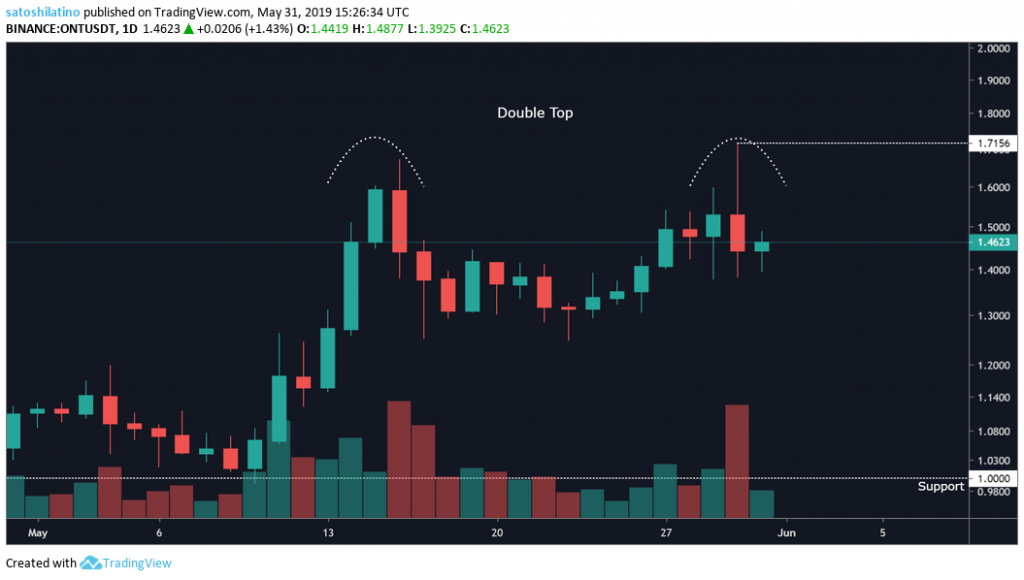
Ontology
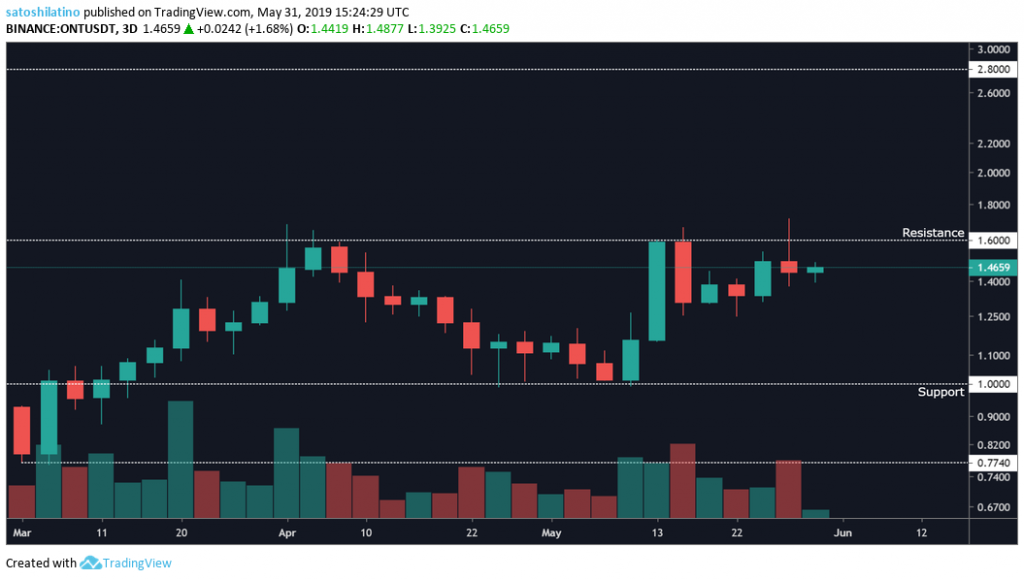
For over two months ontology has been consolidating between $1.6 and $1.0. During this time span, ONT has not been able to make a strong move out of this range.
Currently, this cryptocurrency is trading around the $1.6 resistance level signaling that it could drop to the $1.0 support once again. If volume starts picking up, however, ONT could experience a bullish impulse that takes it all the way up to $2.8, which is where the next point of resistance sits.
A double top formation seems to be developing on the 1-day chart. This is a bearish pattern that predicts an upcoming pullback. It validates what can be seen on the 3-day chart, in the sense that ONT could be about to go back down to $1.0 as it has been doing every time it reaches $1.6 for the last two months.
A move higher could only be expected if ontology is able to trade above the recent high of $1.72.
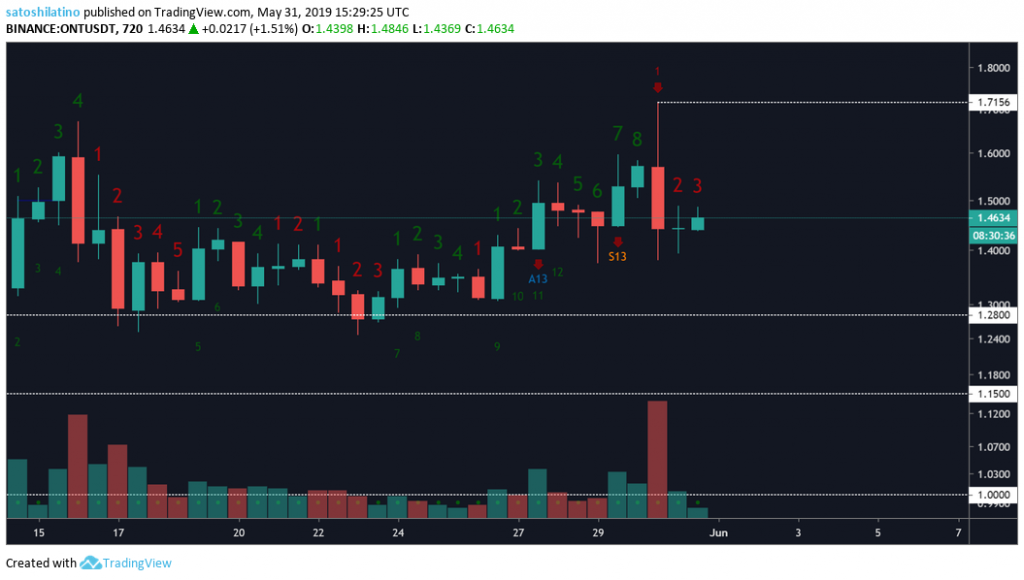
The TD Sequential Indicator gave a sell signal with a green nine on the 12-hour chart. A bearish movement to the $1.28 support level seen on this timeframe could be expected, but if the sell volume is high enough ONT could continue to go down to $1.15 or $1.0.
OmiseGo
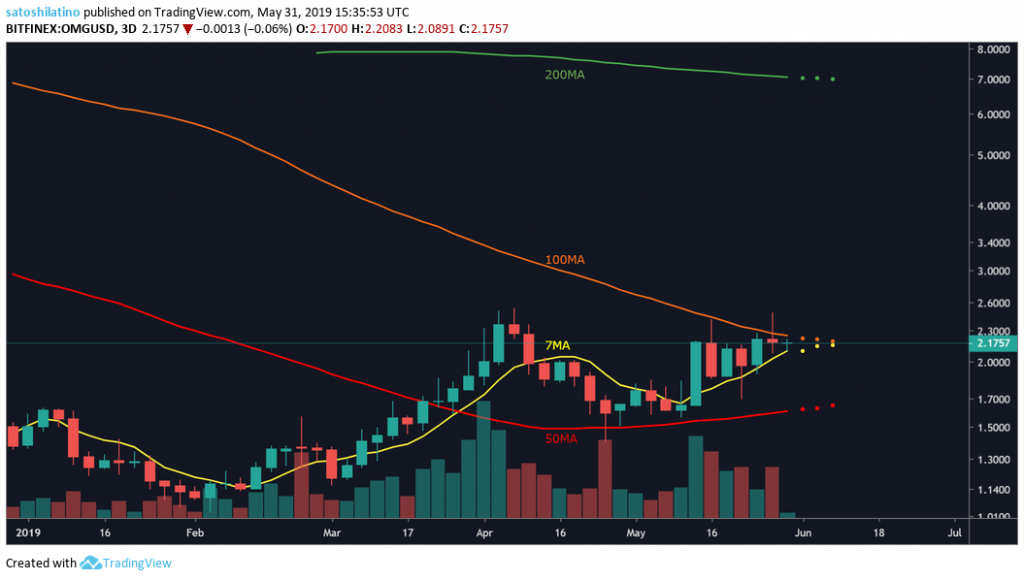
Based on the 3-day chart, the market valuation of OmiseGo has been squeezing between the 7 and 100 moving average. A break above the 100 MA could take this cryptocurrency all the way up to the 200 MA, which is currently sitting around $7.
Nonetheless, if OMG trades below the 7 MA it could drop down to the 50 MA at around $1.7.
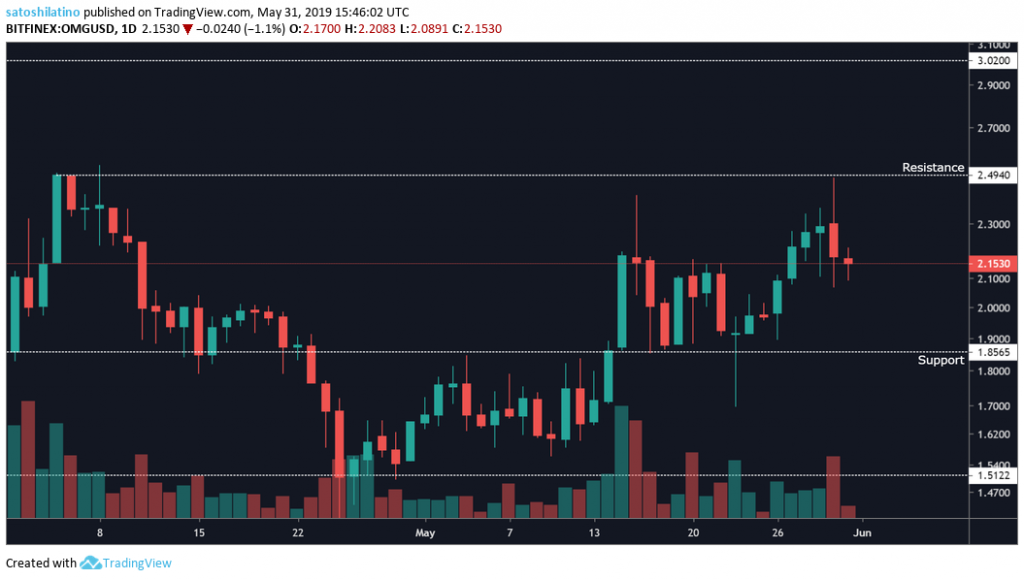
A trading range between $2.5 and $1.5 can be drawn on the 1-day chart with the $1.85 price point acting as the middle support zone. Now that OmiseGo reached the top of the range where it has been trading for over a month, it could be expected that it will go down to test the $1.85 support level.
A break below support could take OMG to the bottom of the trading range, while a break above $2.5 could take it to $3.
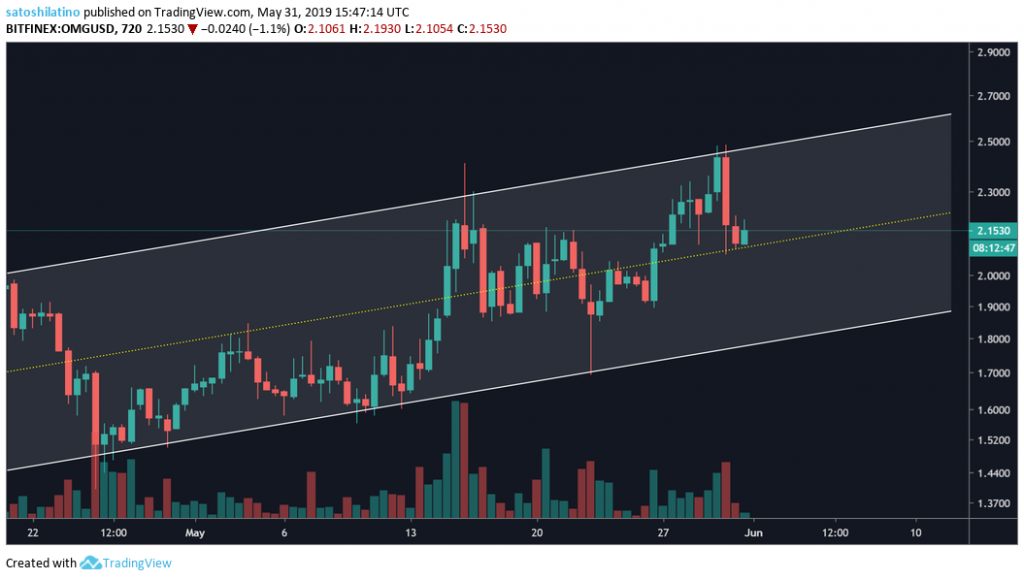
An ascending parallel channel is visible on the 12-hour chart. At the moment, OmiseGo sits on the middle of the channel indicating three possible outcomes. OMG could continue consolidating around this price point, it could fall to the bottom of the channel or it could rise to the top of the channel.
Augur
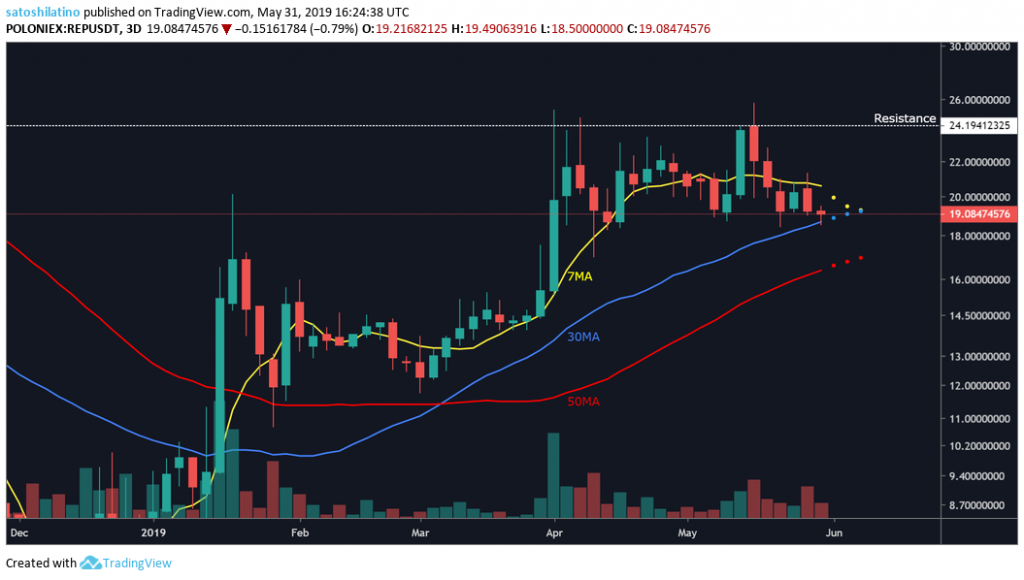
After reaching a low of $5.4 on Dec. 15, 2018, augur has gone up more than 370 percent to reach a yearly high of $25.7 on May 16.
Now, REP retraced to $19 and has been trading below the 7-three-day moving average, which is a bearish sign. So far, the 30 MA seems to be holding its price from a further drop, but if it is no longer able to hold augur could fall down to the 50 MA, which sits at $17.
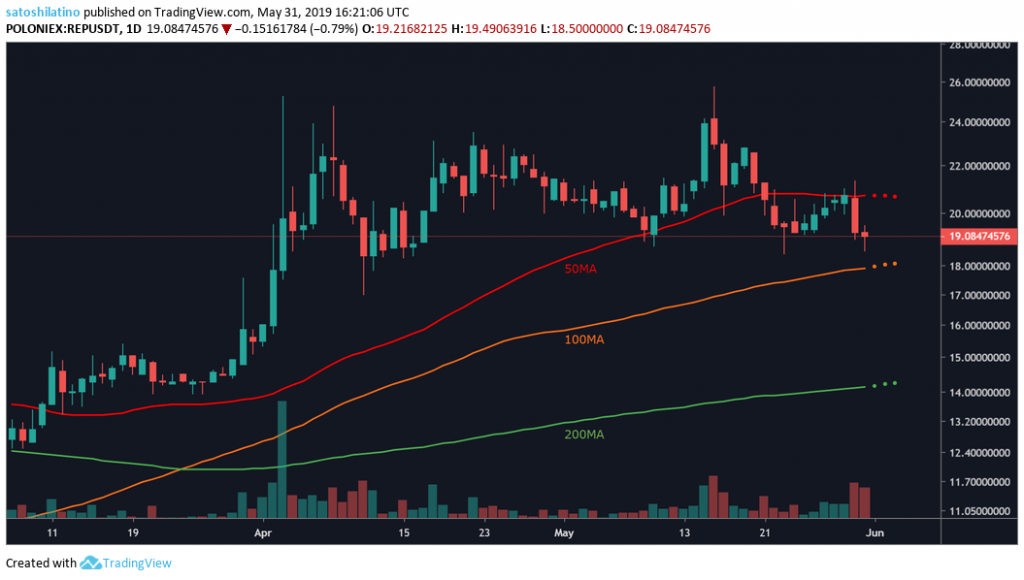
On the 1-day chart, it can be seen how augur was trading above the 50-day moving average since early March, but on May 21 it moved below it. At the moment, it seems like this cryptocurrency could be on its way down to the 100-day MA or even the 200-day MA, sitting at $18 and $14 respectively.
If REP is able to trade above the 50-day MA once again, it could continue its bullish trend taking it to new yearly highs.
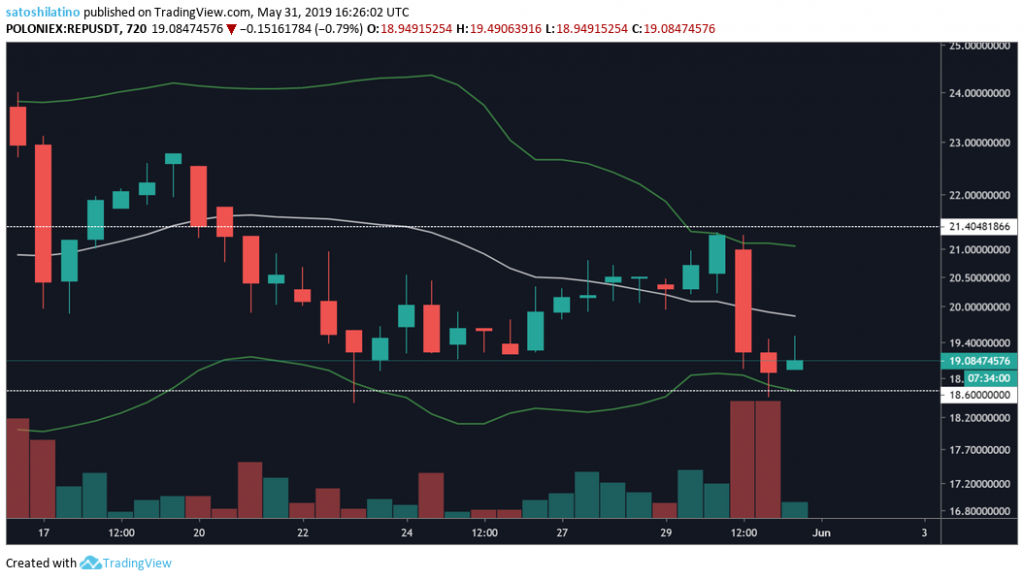
The Bollinger Bands appear to be squeezing on the 12-hour chart indicating a period of low volatility before a breakout is triggered. The levels watch out for are whether augur will move up past $21.4 resistance or drop below $18.6 support. A break above resistance could take this cryptocurrency to new yearly highs, while a move below support could prolong the correction that is currently underway.
0x
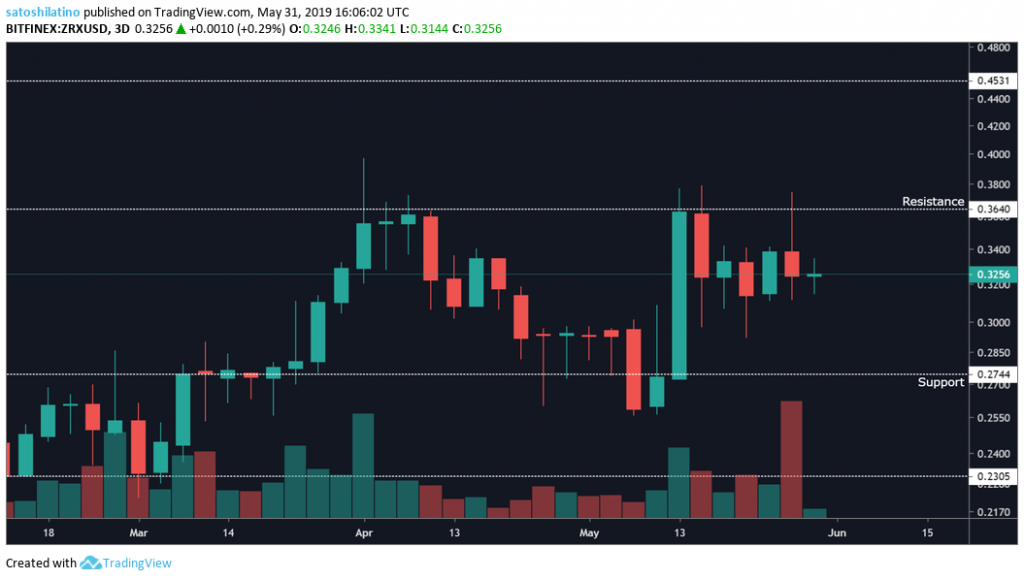
0x has had distinct price action this year. It appears to trade within a price range for a while before moving up to another price range. From late January until late March it traded between $0.27 and $0.23 following a breakout that has it now trading between $0.36 and $0.27 since the beginning of April.
A move above this trading range could take ZRX to $0.45, where it could consolidate before a higher move, but a break move below could take it back to $0.23.
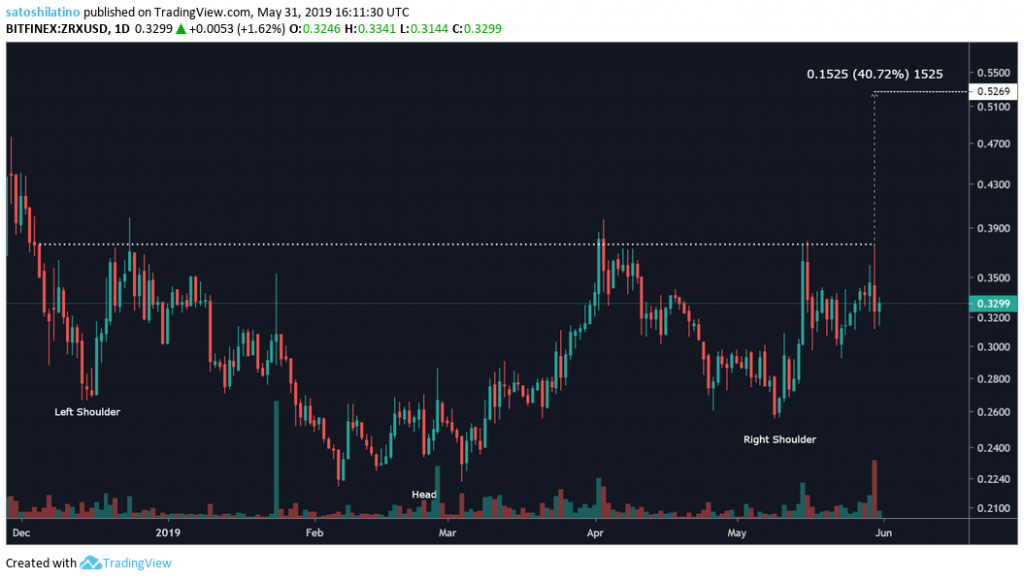
A head-and-shoulder formation seems to be developing on ZRX’s 1-day chart. This is a bullish pattern that predicts a 40 percent move up upon the break of the neckline.
A move above $0.36 will validate this pattern, while a drop below $0.27, which is where the right shoulder sits, will invalidate it.
Overall Sentiment
The market is going through a corrective period following the recent bullish impulse. Although it seems like there is potential for a further drop, this pullback could be part of a healthy continuation of the bullish trend. The different support points will determine whether the market will make new yearly highs or if it is on its way down to new lows.