Bitcoin unfazed by FUD as it breaks through $6000

Cover art/illustration via CryptoSlate. Image includes combined content which may include the use of AI tools.
When bitcoin broke above $4,200 it marked a pivot point in the crypto markets. Since then, bitcoin has surged more than 40 percent and is now attempting to break through a major resistance zone between $6,300 and $6,450.
Bitcoin unfazed by mounting bad news
Despite Bitfinex being investigated for engaging in a cover-up of the apparent loss of almost one billion dollars in co-mingled client and corporate funds, Tether facing criticisms for having cash equivalent reserves that would only cover 74 percent of the amount of the USDT tokens in circulation, and Binance getting hacked 7,000 BTC, Bitcoin—the honey badger in the crypto assets market—doesn’t care and continues to rise.

Following the low of $3,129 on Dec. 15, 2019, bitcoin has experienced a steady increase in its market valuation. So far the pioneer cryptocurrency has appreciated 95 percent since these all-time lows. Although it has not been the most fundamentally bullish five months, BTC has been able to shrug off FUD (fear, uncertainty, and doubt).
Now, BTC holds steady at roughly $6200, which a major price point because of the strong resistance ahead of it. A bullish impulse that allows it to break above resistance will certainly shake off the markets and punish those who remain bearish.
Technically, new highs could come at any minute since Bitcoin could be entering a new “parabolic phase,” as Peter Brandt explained, but there is a chance that the market is setting up for a bull trap.
Post-$6k technical analysis
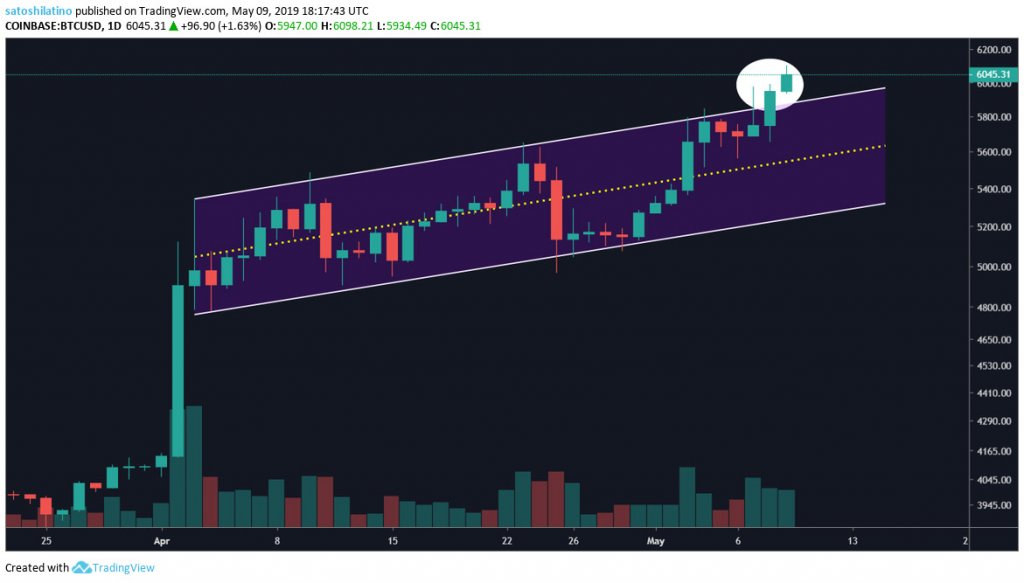
Since Apr. 3, 2019, bitcoin has been trading inside an ascending parallel channel on the 1-day chart.
According to Investopedia, an ascending channel is the price action contained between parallel lines. These lines can be used as support and resistance points to set stop-loss orders and profit targets. A breakout above an ascending channel can signal a continuation of the move higher, while a breakdown below an ascending channel can indicate a possible trend change.
After multiple touches of the upper line and the lower line in the ascending parallel channel, it seems like bitcoin has broken above it, signaling a continuation of the bullish trend. BTC will now have to break through the major resistance zone that extends between $6,100 and $6,450 in order to continue climbing higher.
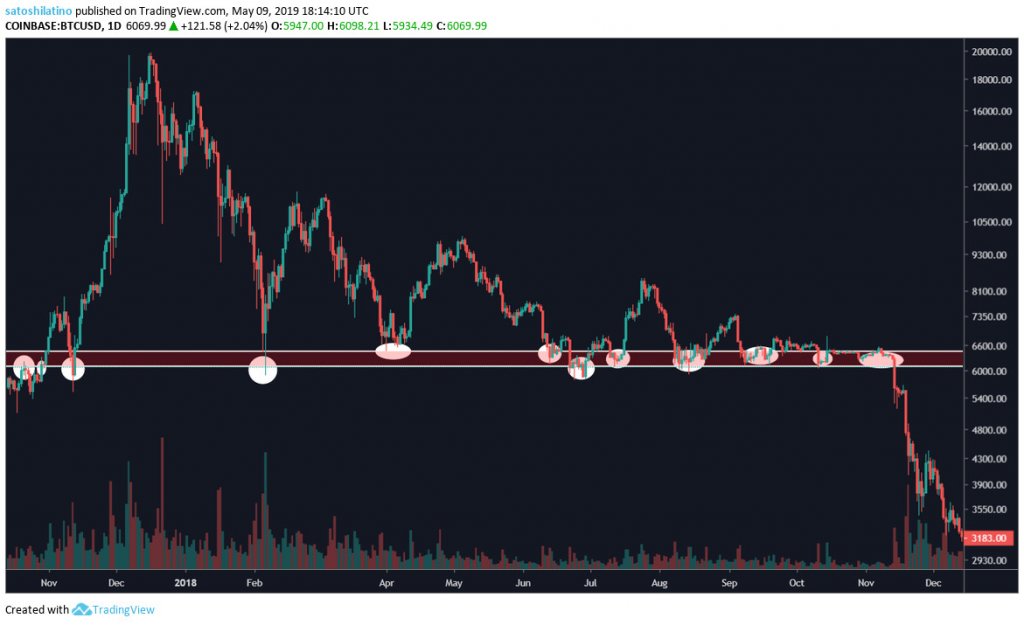
The $6,100 to $6,450 range represents a major resistance zone that dates back to Oct. 2017. On Oct. 15, during the bull run of 2017, as bitcoin was making new highs it got very close to this range, but it was immediately rejected. BTC corrected for three days and rose back to try to break through this level one more time, but it refused to break, and the price was pushed back down 11.6 percent.
Finally, on Oct. 31, the biggest cryptocurrency by market capitalization was able to break above the resistance zone and went all the way up to $7,900. Later on, on Nov. 12 of the same year, a retrace brought it back to the $6,100 to $6,450 range, which made this range a major support zone for the bear market of 2018.
Throughout 2018, the $6,100 to $6,450 range served as a support zone that held the price of bitcoin on multiple occasions. Every time BTC went down to this level it quickly bounced off.
The first time it did was on Feb. 5. When bitcoin was crashing down from $20,000 it touched this range to then quickly rebound back up to $12,000. Around Mar. 30 through Apr. 10, a similar scenario occurred as BTC fell from $12,000. This support zone was tested multiple times until the inevitable. As Tone Vays, a former Wall Street analysts, said, “the more times a support level is tested, the easier it is to break.”
On Nov. 13, 2018, the support zone between $6,100 and $6,450 could not hold the price of bitcoin any longer and it broke down. A 50 percent drop was seen after this support zone was broken. On Dec. 15, BTC went down to trade at $3,129 after making an all-time high of $20,000 just one year earlier.
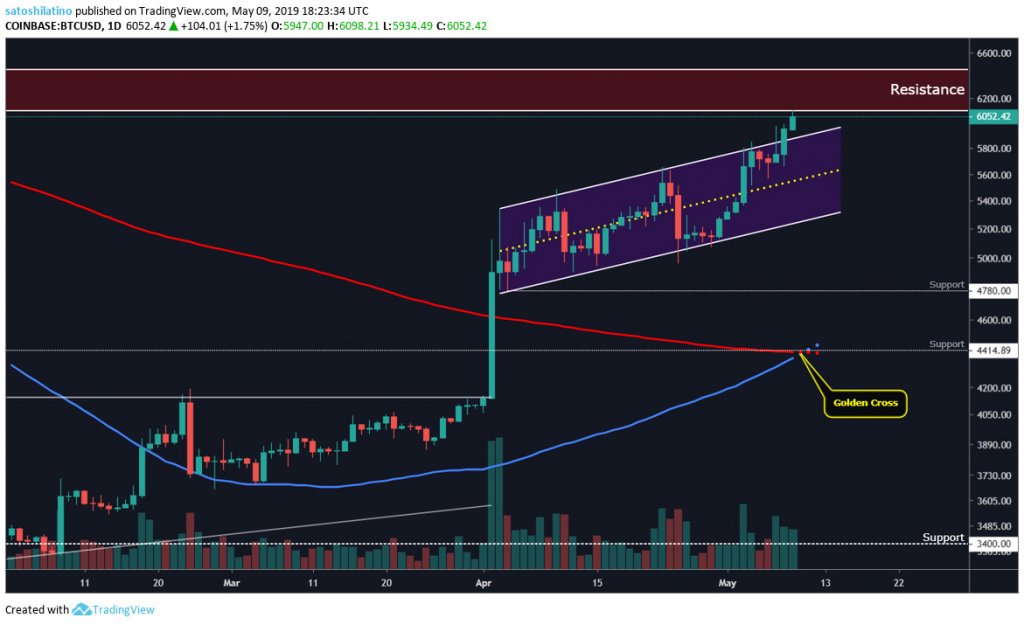
Now five months after making a new low, bitcoin is back up to fighting the $6,100 to $6,450 range once again. There are multiple bullish signs that could indicate a potential break out of this resistance zone.
- Bitcoin has been able to break out of an ascending parallel channel where it had been trading for over a month.
- Per the TD Sequential Indicator, bitcoin is on a green two candlestick trading above the previous green one candlestick, which is used by traders as a buy signal.
- Volume has been picking up and has experienced major spikes in the last few months.
- A golden cross between the 100-day moving average and the 200-day moving average could be fully developed in the next few days. Investopedia details that a golden cross is one of the most notable signs that a bull run is on the horizon.
It will probably be hard for bitcoin to break above the $6,300 to $6,450 range all at once, but it is not impossible with all the bullish attributes that the current trend has. Nonetheless, if a pullback was to come, the upper and the lower lines of the ascending parallel channel will represent levels of support, as well as $4,780, $4,420 which is the level where a golden cross is forming. There is also support at the $4,200 pivot point and strong support around $3,400.
A repeat of 2017?
With all the bullish signals, it seems like bitcoin is preparing for another bull market. However, it is wise to keep a proper risk management strategy because the crypto markets are known for their volatility.
For the different bear markets that bitcoin has had, such as the one in 2014 and the other one in 2011, the bottom was marked by a false bullish signal. Investopedia defines it as a bull trap—which is when a declining market trend reverses after a convincing rally and breaks a prior support level.
“The move ‘traps’ traders or investors that acted on the buy signal and generates losses on resulting long positions.”
Bull traps tend to occur when buyers fail to support a rally above a breakout level. The $6,300 to $6,450 is that breakout level to watch out for. If bitcoin is not able to break above it with enough volume, a sharp decline in prices could be expected.
In the case there is enough volume for a break above the $6,450 resistance zone, then a pullback to these levels may also be expected as a support zone for the potential next bull run.