Bitcoin Golden Cross forms—beginning of the bull market?

Cover art/illustration via CryptoSlate. Image includes combined content which may include the use of AI tools.
The crypto winter might be over. Bitcoin (BTC), the pioneer cryptocurrency, has formed its first golden cross since Oct. 27, 2015, marking a pivot point for the entire market.
Explaining the Terms
Before going into details, it is necessary to explain the three primary indicators in this analysis: the moving average, golden cross, and death cross.
A moving average (MA) is an indicator that analyzes different data points by generating a sequence of averages. Investopedia describes it as a tool to “help smooth out price action by filtering out the ‘noise’ from random short-term price fluctuations.” Because it follows a trend, it is based on past prices and can determine the milestones in a market trend.
A golden cross occurs when a short-term moving average crosses above a long-term moving average signaling a potential bullish breakout. Many investors see this pattern as one of the most definitive and strong buy signals that could start a long-term bull market.
Conversely, a death cross appears on a chart when an asset’s short-term moving average crosses below the long-term moving average indicating the potential for a major selloff.
As explained in Investopedia:
“It is a reliable predictor of some of the most severe bear markets of the past century: 1929, 1938, 1974, and 2008.”
Bitcoin Technical Analysis
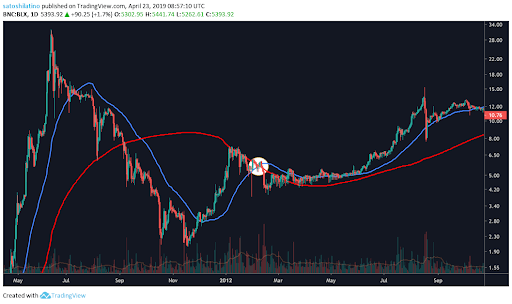
In Feb. 8, 2012, bitcoin formed its first golden cross on the daily chart when the 50-day moving average went above the 200-day moving average. Although the price fell 30 percent right after this pattern formed, it marked the beginning of a bull rally that lasted 13 months and posted gains of 6,789 percent.
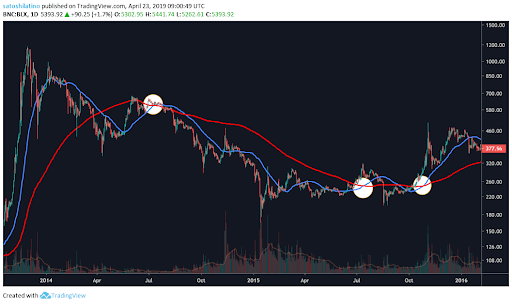
The second time a golden cross formed on the daily BTC chart was in Jul. 11, 2014, which was then invalidated by a 27 percent downward movement. This move created a death cross between the 200-day MA and the 50-day MA in Sep. 4, 2014, pushing a 67 percent market value depreciation.
A similar situation happened a year later, on Jul. 13, 2015, when a golden cross developed, but it was also invalidated by a 27 percent fall that created a death cross in Sep. 14, 2015.
It was then, in Oct. 27, 2015, when another golden cross pattern originated which marked the very beginning of the crypto frenzy. This was a period of high speculation and volatility that represented a 7,000 percent bull rally for the ‘King of Cryptos.'
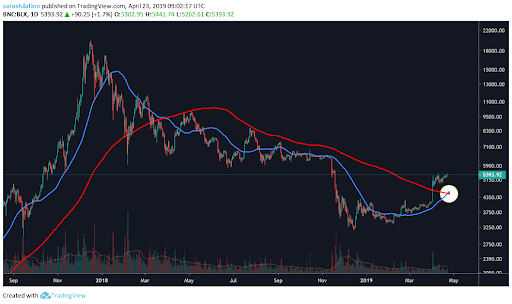
Today, the largest cryptocurrency by market cap has formed another golden cross for the first time in four years. The milestone came after a 76 percent bullish momentum since the low of Dec. 17, 2018, when bitcoin was trading at $3,148. Apr. is on track to be the best month since this cryptocurrency topped back in Dec. 17, 2017, and trading volumes are skyrocketing in the futures market at CME Group Inc.
Breakout or Bull Trap?
Even though it seems like the crypto winter might be over after the recent bull rally that bitcoin has experienced, it may be wise to wait for further confirmation. The golden cross pattern is definitely one of the strongest indicators to foresee a bull market on the horizon, but it isn’t perfect. Just as the pattern failed multiple times between 2014 and 2015, right now it could be setting the stage for a bull trap.
Before calling an end to the crypto winter it is important to take other analysis and metrics into consideration that could invalidate the golden cross seen on the daily charts.