Altcoins rise as Bitcoin consolidates: Ethereum, XRP, Bitcoin Cash, EOS, Litecoin analysis

Cover art/illustration via CryptoSlate. Image includes combined content which may include the use of AI tools.
The bullish trend continues as most of the top five altcoins continue to make new yearly highs. Although a correction could be expected at any moment, the bulls seem to have control over the entire cryptocurrency market.
Ethereum
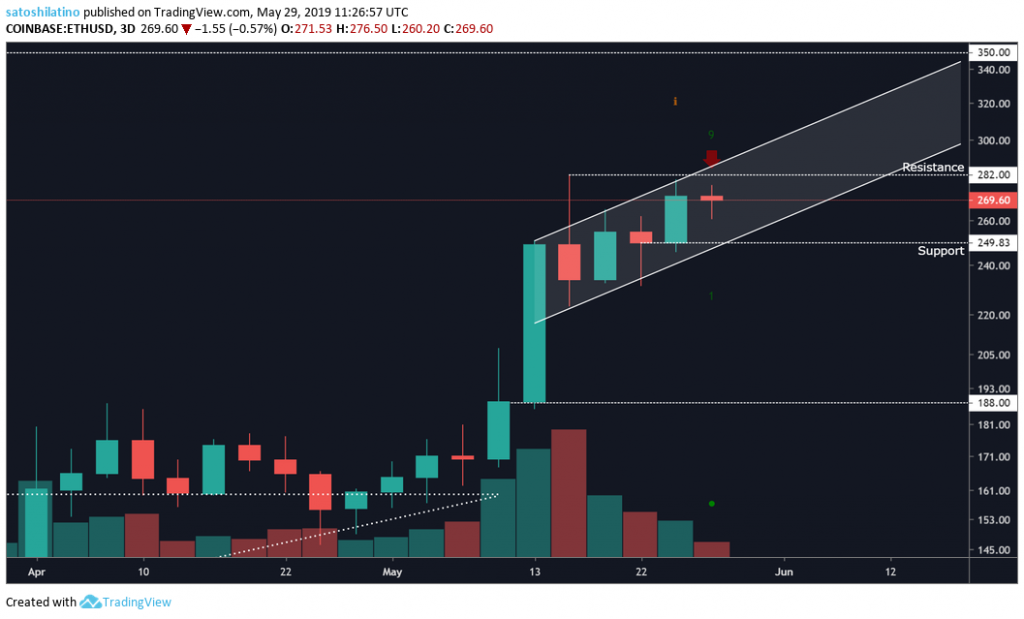
The bullish impulse ethereum experienced has not ended after breaking above the ascending triangle that formed on the 3-day char. During the last two weeks, it has continued trending up in an ascending channel.
Now the TD Sequential Indicator is giving a sell signal with a green nine on what appears to be a reversal candlestick. If the signal is validated, ethereum could correct for three to twelve days before a continuation of the bullish trend.
The $282 resistance and $250 support levels represent important points when analyzing ETH. A break above resistance could take this cryptocurrency up to $350, while a break below support could take it down to around $190.
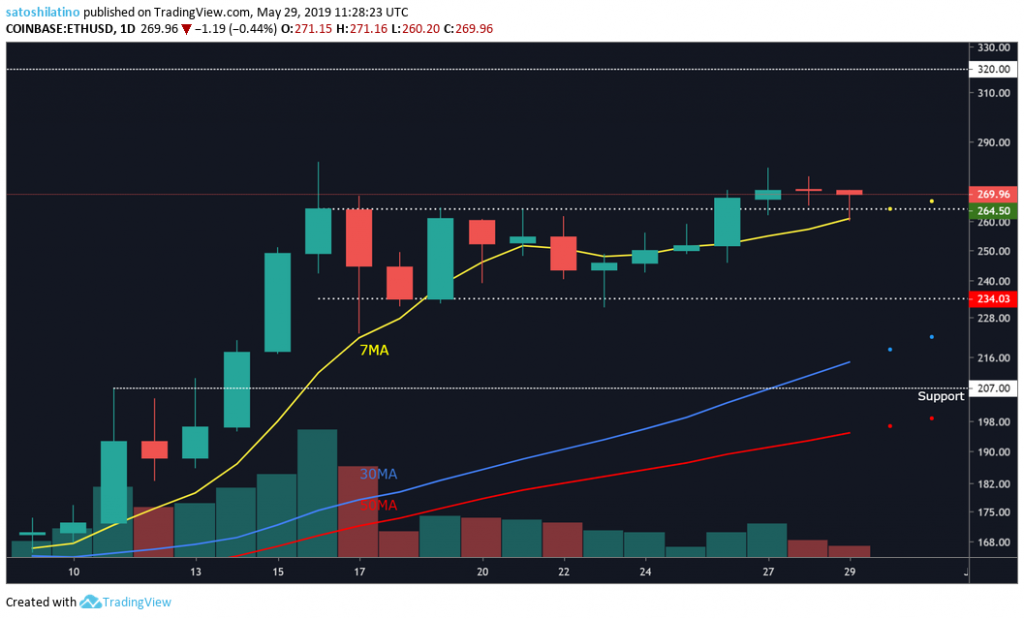
Ethereum was trading within a $30 no-trade zone between $264 and $234 for eleven days. On May 27, it was able to break out of the range, but without enough volume for a higher move.
If volume starts picking up and ETH remains trading above the 7-day moving average it could continue rising to test the $320 resistance level that can be seen on the 1-day chart.
On the bearish side, a drop below the 7-day MA could take ethereum down to test the 30 or 50-day MA, which are sitting between $220 and $200.
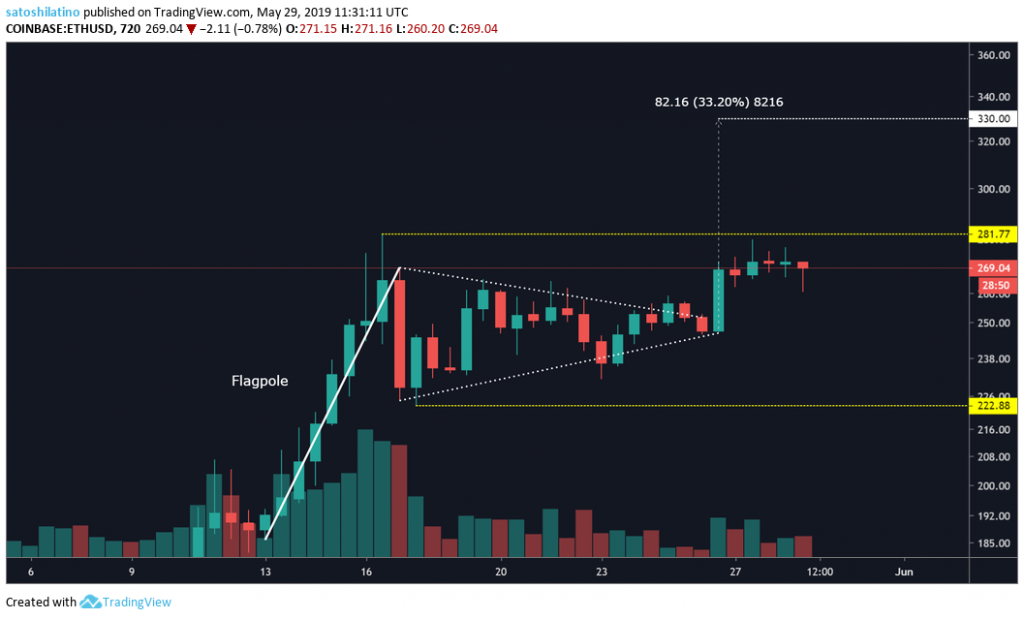
A bull pennant appears to have been formed on the 12-hour chart. Although ethereum has broken out of the pennant, the volume has not been significant enough to break above the previous high of $282 to make it reach $330, which is the target given by the bull pennant.
Based on the 12-hour chart, it will be wiser to wait for a break above $282 or below $222 to enter a bullish or bearish trade.
XRP
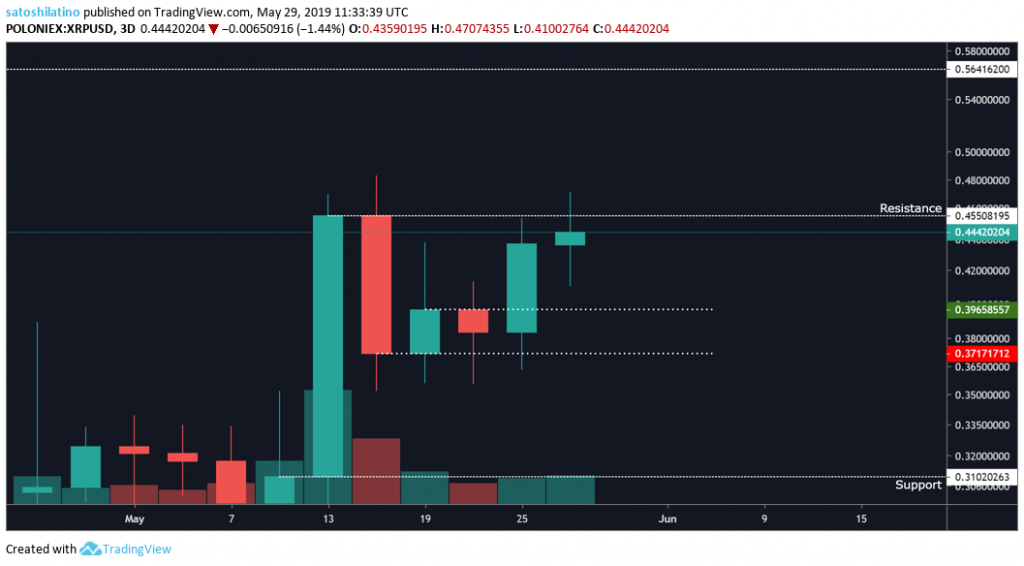
The trading range between $0.4 and $0.37 where XRP had been trading last week was broken to the upside and was immediately noticed by DonAlt, a cryptocurrency analyst.
I hereby join & summon the XRP army.
Support XRP on its way to glory.
Make this thing moon by all that is holy, join the ranks of XRP.I think this is either the bottom or XRP goes much much lower.
I'll buy here and I'll buy again in the next green zone if stopped out. pic.twitter.com/EEIdb1L8zt— DonAlt (@CryptoDonAlt) May 28, 2019
Now that XRP has reached the $0.45 resistance level, it could take a while before it breaks it. A move above this resistance level could take XRP up to the next level of resistance sitting at $0.56.
If XRP is not able to gain enough bullish momentum to continue rising, the first level of support will be given by the $0.4-$0.37 range.
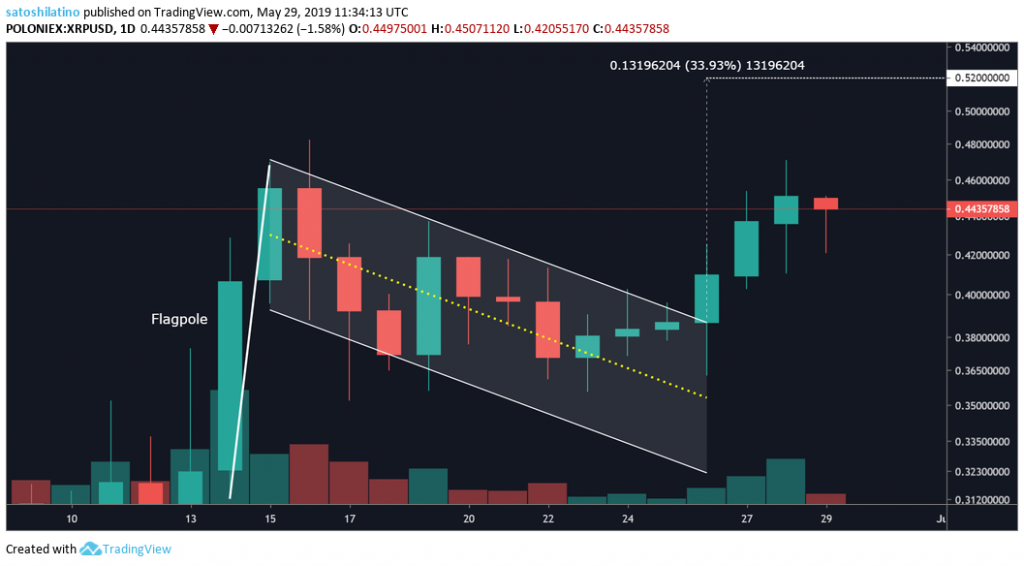
A bull flag broke out on XRP’s 1-day chart. This pattern projects a target of 33.5 percent to the upside, out of which 22 percent has already been reached. If the volume continues to pick up, XRP could rise up to $0.52 to reach the final target given by the flag.
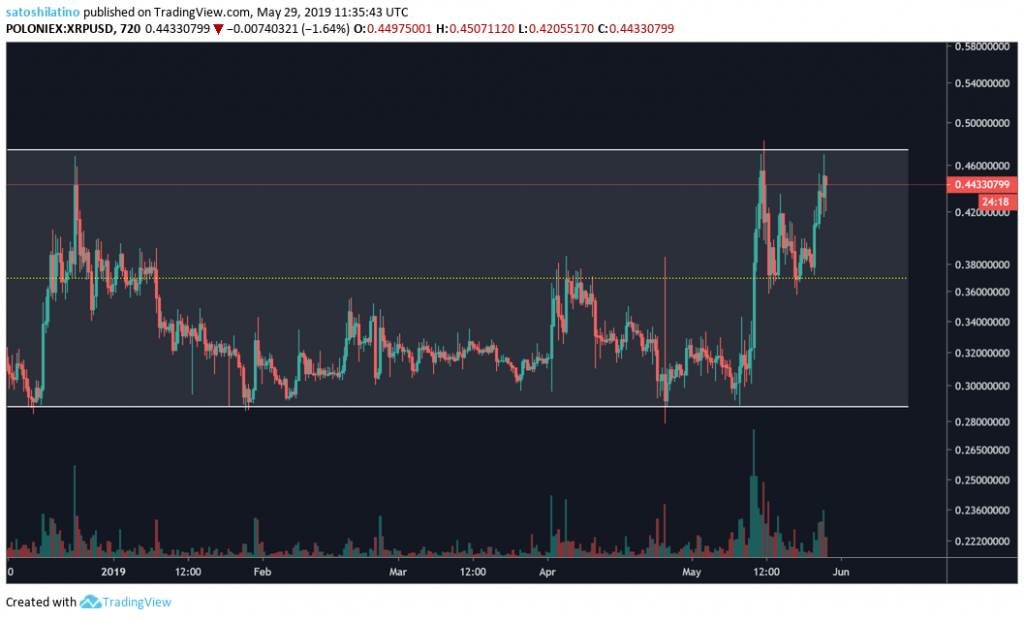
XRP can be seen trading in a parallel range since Dec. 2018. Now that it has reached the top of the channel two outcomes could be expected. XRP could retrace to the middle line of the channel, which sits around $0.37, or it could move above the channel.
A break out of the parallel channel could take this cryptocurrency to new yearly highs in an extremely bullish movement due to the length of the channel. Thus, the $0.48 level is a very important price point to watch.
Bitcoin Cash
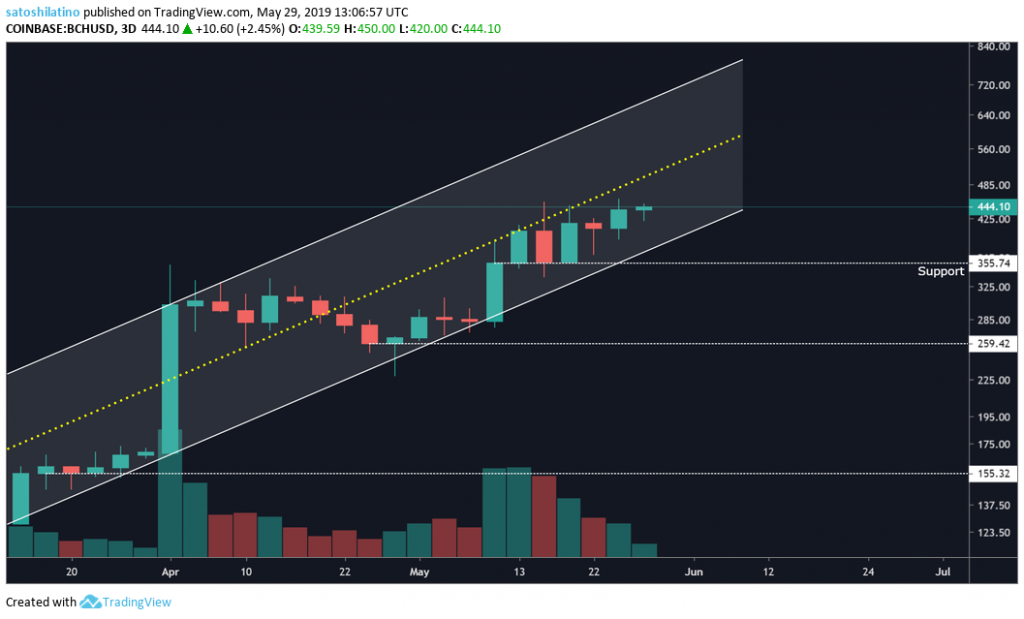
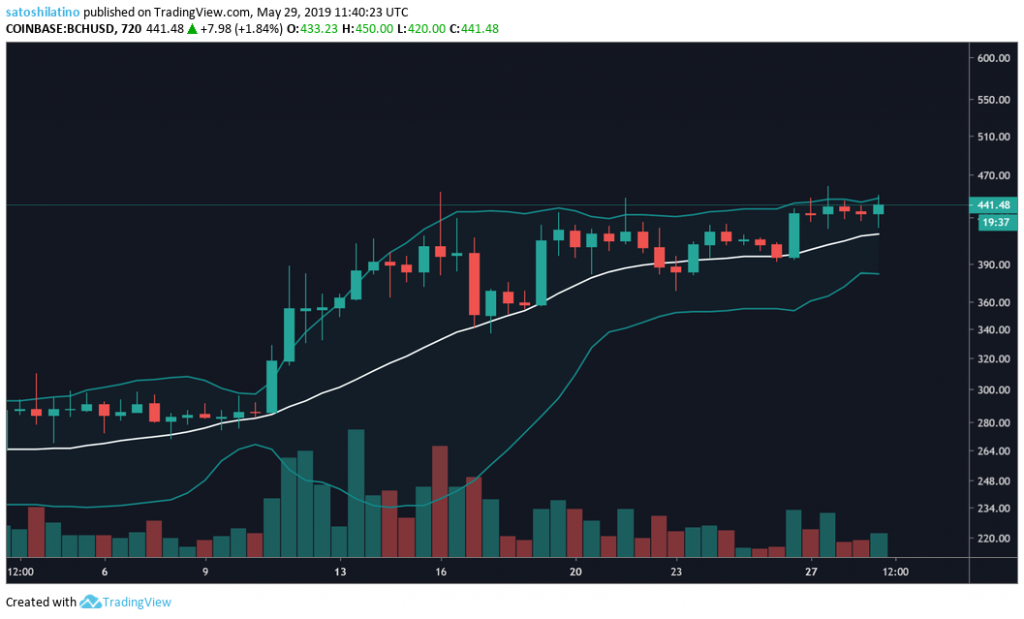
An ascending parallel channel has formed on bitcoin cash’s 3-day chart since the middle of March. Although it has been trading in an upward movement on the lower side of the channel, a break above the middle line could provide significant gains.
Nonetheless, if BCH trades below the channel and the $356 support level, a drop down to $260 could be expected.
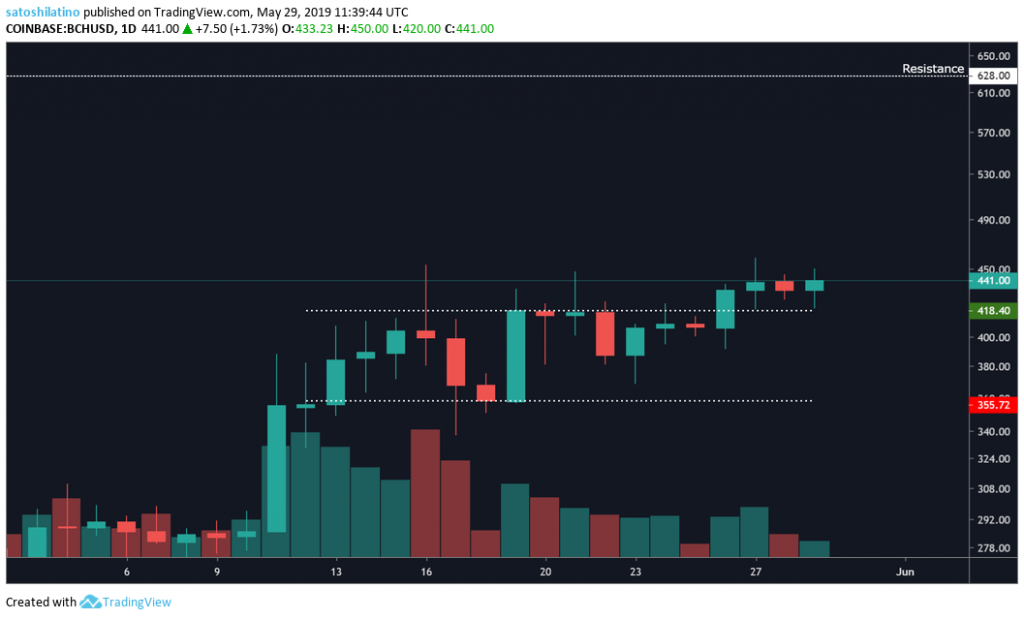
Bitcoin cash has broken out of the $60 trading range between $420 and $360 where it was sitting for two weeks. A spike in volume could take BCH to the $630 resistance level based on the 1-day chart. Conversely, if this cryptocurrency moves below $420 it could go down to $360 once again.
On the 12-hour chart, the Bollinger Bands can be seen squeezing indicating that a period of high volatility could come soon. Since BCH is trading around the upper band it could be expected that the next move will be bullish and it will try to reach the targets previously mentioned.
EOS
EOS has recently moved up to the number five spot in market capitalization pushing litecoin down as it prepares for an announcement in June, which according to Dan Larimer, the lead programmer of EOS, will be the “biggest news since [the launch of] EOSIO.”
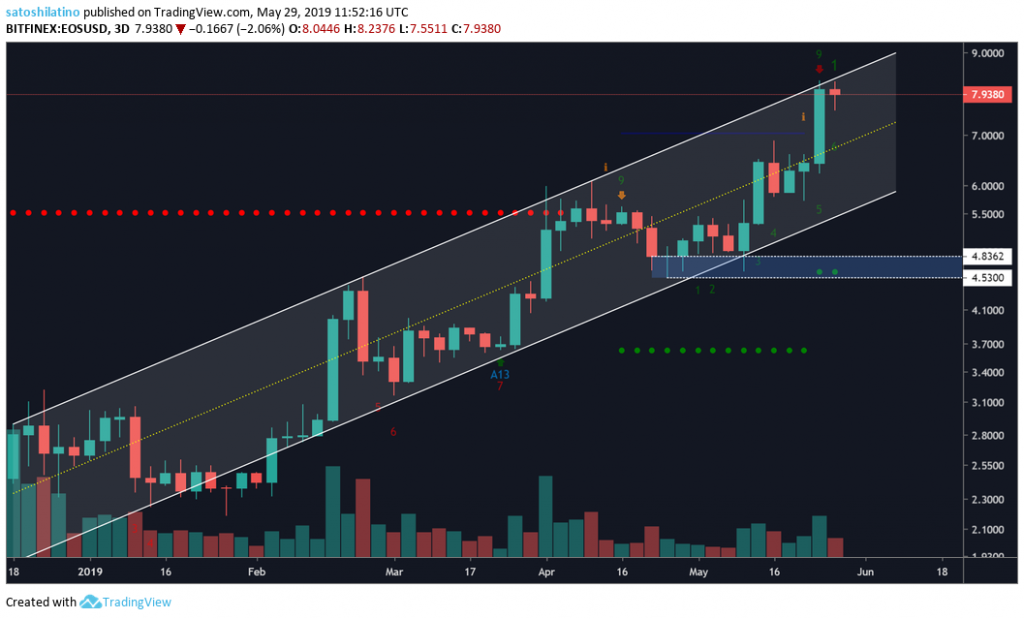
This cryptocurrency has been trading inside an ascending parallel channel since Dec. 18, 2018, after reaching a low of $1.55. Now that this cryptocurrency is trading at the top of the channel a sell signal has been given by the TD Sequential Indicator with a green nine.
From this point, a move down to the middle line or the bottom of the parallel channel could be expected. If the correction does not come and EOS breaks above the channel, it could create enough bullish momentum for a significant move up.
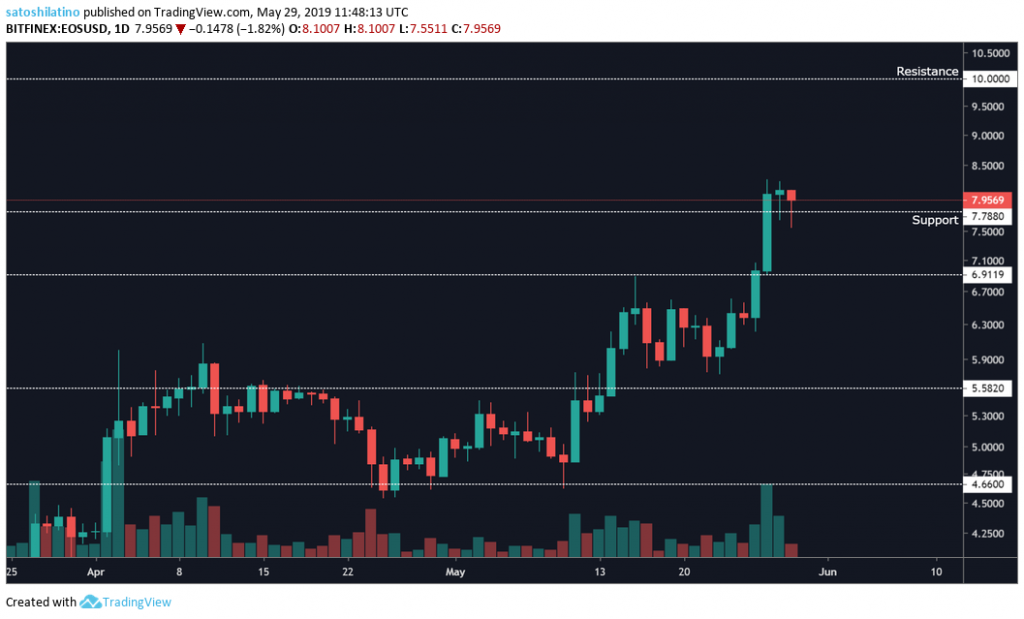
On the 1-day chart, EOS is trading around support. A continuation of the bullish trend could take it up to the $10 resistance level. However, a break below the $7.78 support level could take it down to $6.9 or $5.6.
Litecoin
Since Dec. 2018 litecoin has experienced a steady increase in its market valuation that could have been influenced by the upcoming block reward halving that is just 68 days away.
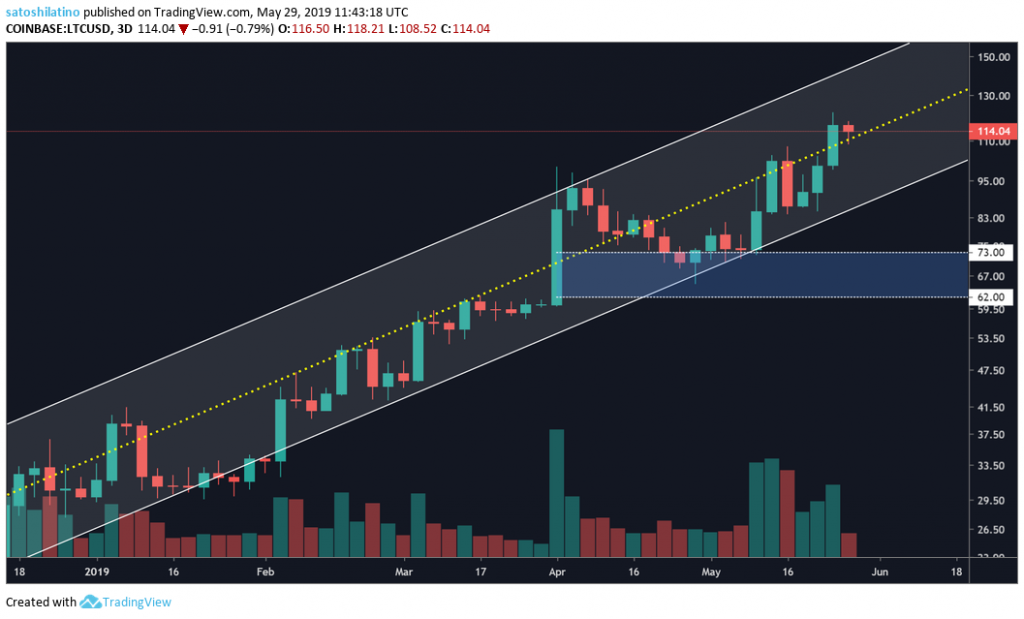
LTC is currently sitting inside an ascending parallel channel just above the middle line and it could continue to rise to the top around $150. However, if it happens to move below the middle line, this crypto could go down to the bottom of the ascending parallel channel around $95 based on the 3-day chart.
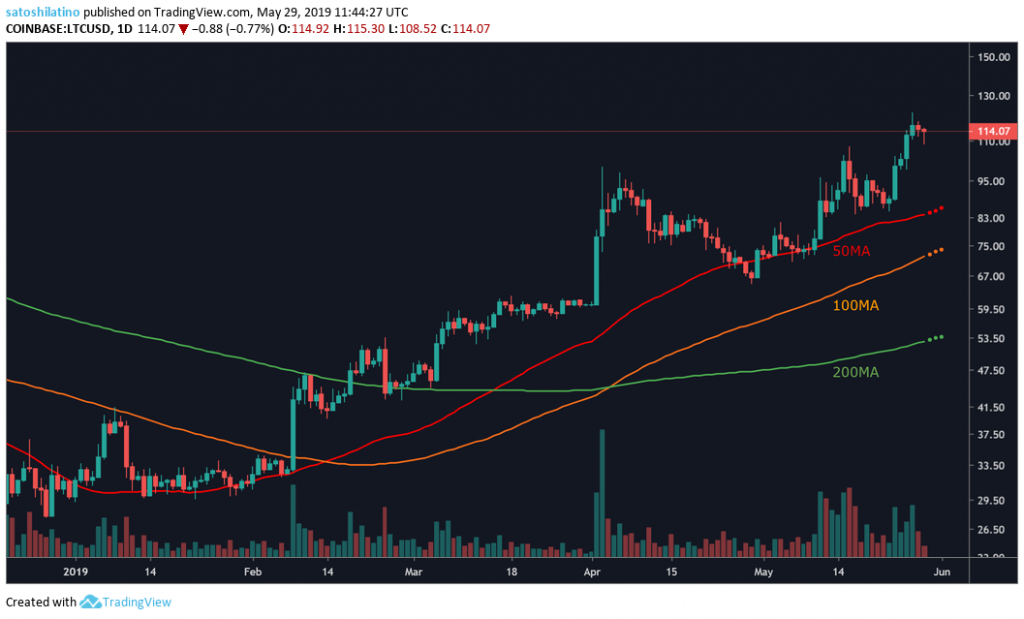
On the 12-hour chart, it can be seen how litecoin has been trading above the 50 moving average since the beginning of the year. The bullish trend will remain as long as LTC continues trading above this moving average, but a correction could be seen if it moves below it. The next levels of support are given by the 100 MA sitting at $75 and the 200 MA at $55.
Overall Sentiment
The top altcoins remain bullish as most of them continue to make new yearly highs. Although the TD Sequential Indicator is giving signs of a possible correction, the trend in increasing market valuation for these cryptocurrencies remains intact. It is possible that when the correction happens, it could be significant based on the bullishness of the trend. That said, the pullback may be needed for a healthy continuation of the upward movement.