 Bitcoin analysis: technicals suggesting continuation of strong growth period
 Bitcoin analysis: technicals suggesting continuation of strong growth period

Cover art/illustration via CryptoSlate. Image includes combined content which may include AI-generated content.
As Bitcoin consolidates above former resistance, reversing its recent downtrend, using technical analysis, traders are noticing that another potential upward movement could be in play in the near future.
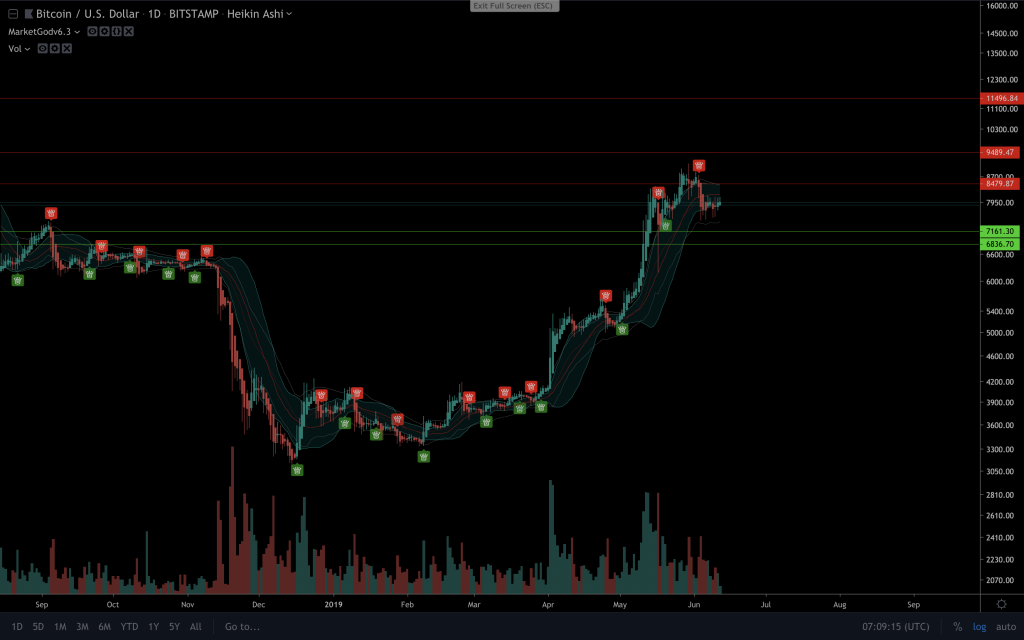
Despite a parabolic April and May, Bitcoin appears to be gearing up for another potential move upward in mid-June. While many expected another few weeks of consolidation, Bitcoins continued resilience at $7,800 will likely attract buying power, and has the potential to carry price to its next major resistance at $9,400. The short to medium term potential supports and resistances are highlighted below.

The bullish sentiment was a recent development in the markets as of Monday, as prior consensus implied a much needed period of continued consolidation and a possible short term downtrend to the $6,000 level.
Monday’s shift in sentiment could be in part to several events, although Litecoin’s surge to over $140 certainly has bears on the retreat across all parts of the crypto-ecosystem.
Considering Litecoin has been a leading indicator for incoming market moves for the previous six months, the sentiment for Bitcoin’s incoming price movements has quickly shifted to bullish across the majority of timeframes.
Criteria for Continuation
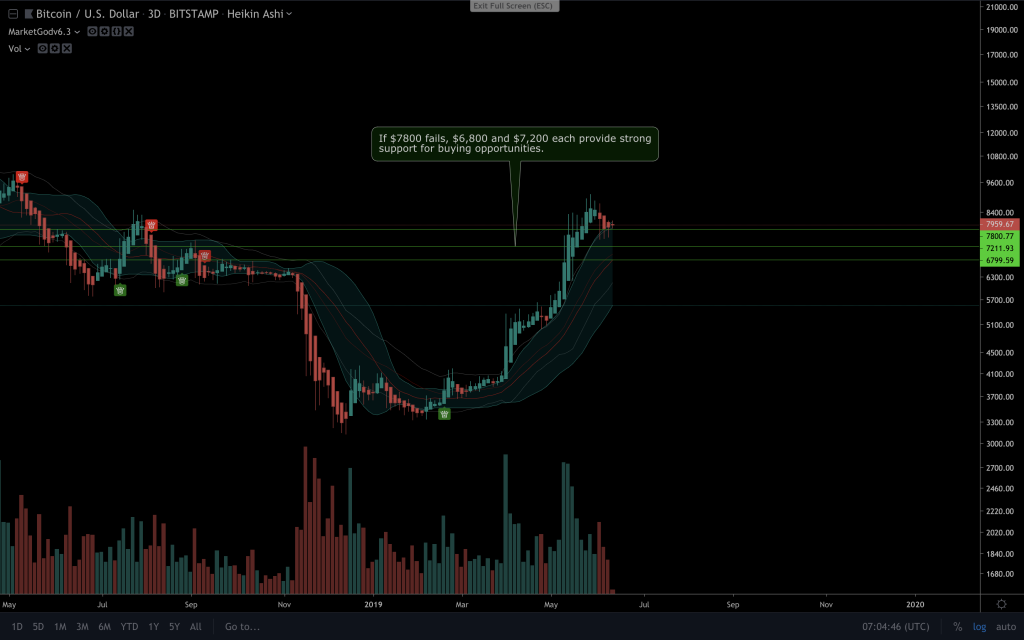
As long as bulls maintain $7,800, the continuation of this explosive period should be expected. In the event the price drops instead, look for $7,200 and $6,800 to provide strong buying strength, as they are each proven and historic buying ranges from the 2017/2018 price moves, respectively.
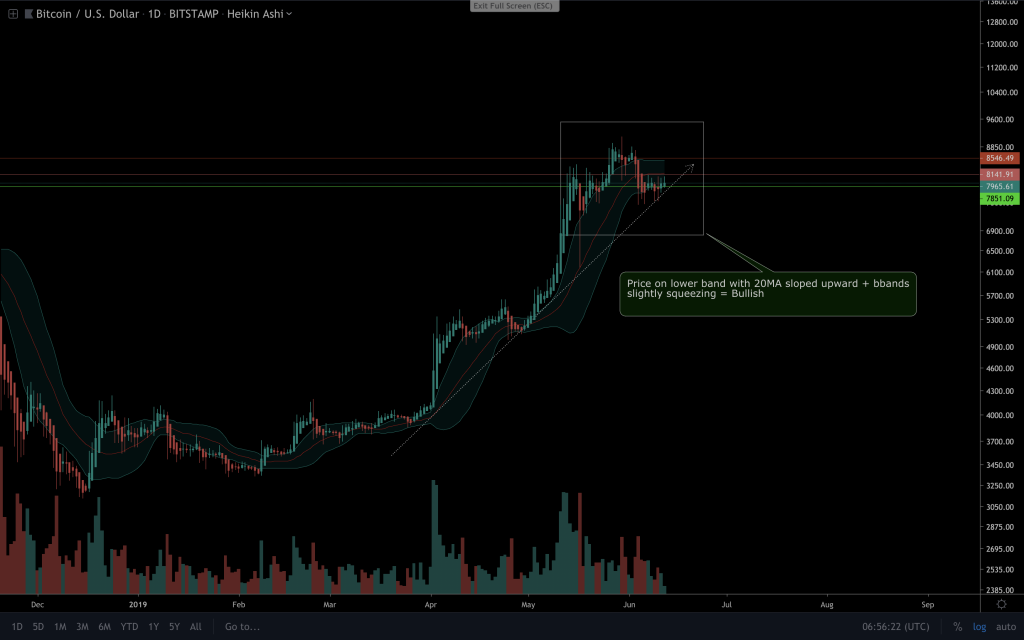
Shorter-term, on the one-day frame shown, resistances lie around $8,100 and $8,600, although movement beyond these levels suggests price movement to the $9,400 resistance, which potentially will be a resting place for consolidation after the expected move up comes into reality.

Major Resistances: $8,600, $9,400, $11,400 & Beyond
The first major resistance is at $8,600 and the second is at $9,400. The three-week chart has Bollinger bands that are still pointing at that price, rather than expanding away. In these cases, resistance is forming, which may be easily broken considering it is on an unconventional three-week period timeframe.
With an extended move upward, $8,600 would become an implied zone for the first wave up to stop initially, before quickly moving to $9,400 before an expected dip.
Third and fourth resistances belong to $11,400 and $13,000: The one-month top Bollinger band resides at the $13,000 range, and much like $8,600 to $9,400, the assumption is that $8,600 will see an initial impulse wave from $9,400, with the ultimate goal being $13,000 and beyond.
With good reason, this range is just below the point of the parabolic break from late 2017. There will be plenty of warning before getting here, and it could be months away.
RSI Trend Disagreement

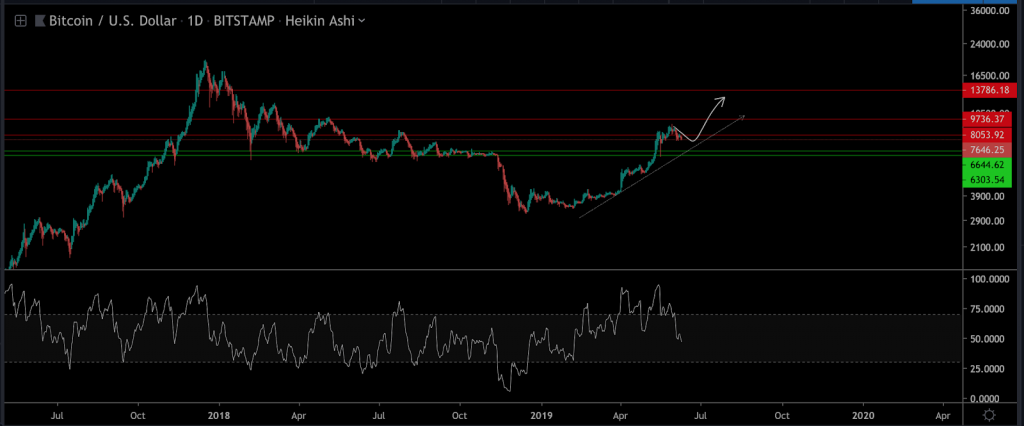
Despite the bullish sentiment in the market, history shows an RSI trend that is well worth noting. Below is the three-day chart going back to 2015 with an RSI oscillator applied.
Notice the price reaction when RSI is greater than 90. These drops average 31–60 percent and take a month or longer to complete before continuing to the upside. Applying this logic to the current scenario, the price would then drop to or below $6,000 for June through July before continuing on the uptrend in July to August.
Disclaimer: None of the information above should be construed as investment advice. Trading cryptocurrencies is extremely risky and we advise our readers to only trade what they can afford to lose.
Bitcoin Market Data
At the time of press 2:52 am UTC on Nov. 7, 2019, Bitcoin is ranked #1 by market cap and the price is up 0.42% over the past 24 hours. Bitcoin has a market capitalization of $141.78 billion with a 24-hour trading volume of $17.82 billion. Learn more about Bitcoin ›
Crypto Market Summary
At the time of press 2:52 am UTC on Nov. 7, 2019, the total crypto market is valued at at $256.13 billion with a 24-hour volume of $61.55 billion. Bitcoin dominance is currently at 55.36%. Learn more about the crypto market ›


