XLM, TRX and ADA are bouncing, but is the carnage over?

Cover art/illustration via CryptoSlate. Image includes combined content which may include the use of AI tools.
Over the last week, $50 billion were wiped off the total crypto market capitalization. The losses are visible throughout most cryptocurrencies in the industry. Now, it seems like the carnage could be over, or at least temporarily paused.
In fact, Stellar Lumens, TRON, and Cardano are signaling a rebound from the current price levels after plummeting for the last few days. The following technical analysis will evaluate whether there is a chance for these cryptos to surge.
Stellar Lumens (XLM)
In the last ten days, Stellar Lumens plunged over 35 percent. This cryptocurrency went from trading at a high of $0.083 on Nov. 12 to a low of $0.053 today. Despite the bearish momentum, several technical patterns estimate that XLM could be bound for a bullish impulse.
Based on the 1-day chart, Stellar appears to be forming a Dragonfly Doji. This type of candlestick pattern signals a potential price reversal from bearish to bullish. The long lower shadow represents the sell-off seen during the period of the candle. But, as the day is closing, the demand for XLM is increasing, which is pushing the price back up.
The TD sequential indicator also adds credibility to the idea of a potential upswing from the current levels. This technical index is presenting a buy signal in the form of a red nine, under this time frame. This bullish signal estimates a one to four days correction to the upside or the beginning of a new upward countdown.
Validation of both of these bullish formations could allow Lumens to rise and test the support given by the 100-day moving average. Breaking above this moving average could signal a further advance to the 150 or 200-day MA, sitting at $0.074 and $0.087, respectively.

XLM’s 4-hour chart also presents a bullish outlook. Under this time frame, a Morning Star Doji was formed. This is a bullish reversal formation that occurs at the bottom of a downtrend. Morning Star Dojis are composed of three candlesticks: a long red candle, a short candle, and a green candle. The combination of these three candlesticks indicates that Stellar Lumens is gaining bullish momentum and is likely to reverse to the upside.
Even though Stellar looks bullish based on its 1-day and 4-hour chart, a further increase in supply could invalidate the optimistic outlook. A close below the recent low of $0.053 could be considered as a confirmation that this crypto is aiming for lower lows.
TRON (TRX)
TRON’s downturn is very similar to the one that Stellar Lumens went through. Since Nov. 13, this crypto also plummeted 35 percent from a high of $0.020 to a low of $0.013. This price action led a bearish engulfing candlestick to form on TRX’s 1-month chart.
The current month’s candlestick is overlapping the body of the previous one. This is considered a bearish formation that is likely to push the price of TRON into lower lows. However, this pattern tends to be more effective when its preceded by four or more green candlesticks. And, it would get validated once the succeeding candlestick closes below the engulfing candle.
From a long-term perspective, TRON does not look good. But, it seems like this cryptocurrency could be bound for a rebound, based on a lower time frame.
As a matter of fact, a bullish hidden divergence between the relative strength index (RSI) and the price of TRX is developing on its 1-day chart. Divergences occur when an oscillator, such as the RSI, disagrees with the actual price movement. Thus, a RSI making a series of lower lows while prices are making higher lows is indicative of an improving trend. And, the probability for a trend change increases.
If this bullish formation is confirmed, TRON could end the month of November at higher prices, which could potentially invalidate the bearish engulfing seen on its 1-month chart. Everything would depend on the buying pressure behind this cryptocurrency and if it can rise to at least about the 50 percent Fibonacci retracement level that sits at $0.017.
Cardano (ADA)
Over the past few weeks, Cardano saw the launch of exciting new projects and updates. Additionally, Charles Hoskinson, the CEO of IOHK, recently said that the balance check for Shelley’s incentivized testnet has finally happened and was a success.
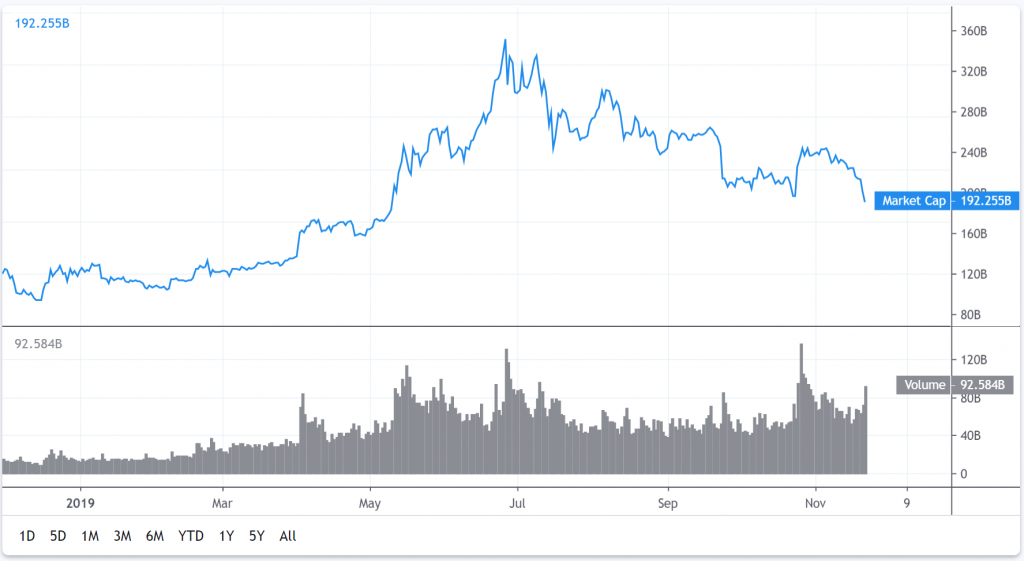
Despite the developments seen in this cryptocurrency, they have not stopped it from falling. As both of the cryptocurrencies previously evaluated, Cardano also experienced a massive sell-off. Since the high of Nov. 17, when ADA was peaking at $0.046, it plunged over 26 percent to a low of $0.034.
Now, a Dragonfly Doji seems to be forming on its 1-day chart. If validated, this candlestick pattern could be signaling a price reversal and an increase in the demand for ADA.
Based on a series of support and resistance levels, If Cardano closes above the $0.040 resistance level, it could rise to $0.044 or even $0.048. Conversely, a spike in selling orders could take it to the next level of support around $0.033 or $0.030.
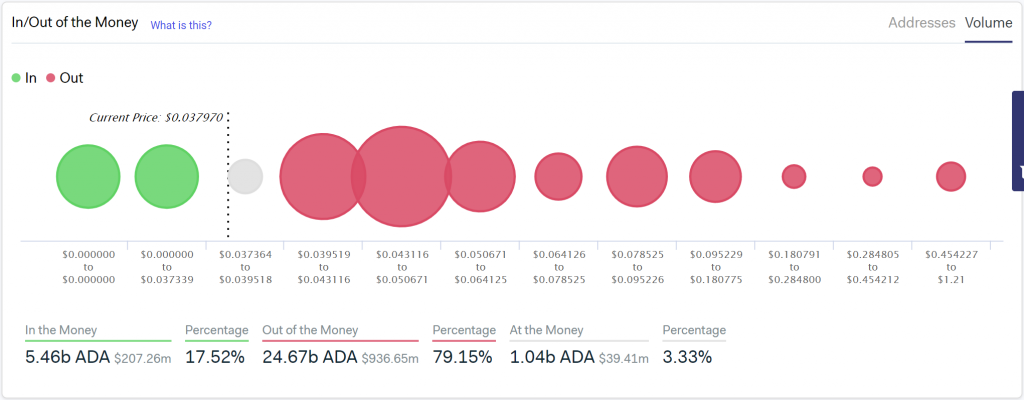
Data from IntoTheBlock shows that there are over 72,000 addresses with balances between $0.040 and $0.050, holding nearly 12 billion ADA. Therefore, this can be considered a significant area of resistance that Cardano must breakthrough to increase the chances for a higher upswing.
Overall sentiment
The decline in prices seen across the entire cryptocurrency market appears to be so steep that investors could be re-entering the market in anticipation of a rebound. Based on the previous analysis, this is precisely what seems to be happening to Stellar Lumens, TRON, and Cardano. Now, it would be wiser to wait for confirmation before entering any trade. This is because the market could still be bound for a further retracement.
It is worth mentioning that TRX is forming a bearish engulfing candle on its monthly chart that anticipates lower lows. Meanwhile, ADA would have to face stiff resistance between $0.040 and $0.050 due to the high concentration of supply around this area.