 On-chain data shows people are hodling Bitcoin despite price slump
 On-chain data shows people are hodling Bitcoin despite price slump
Bitcoin isn't changing hands as much as its current price would have you think.

Cover art/illustration via CryptoSlate. Image includes combined content which may include AI-generated content.
The latest data from analytics company Glassnode showed that people have spent the last few months of 2021 hodling their Bitcoin.
And according to various on-chain metrics, this trend is set to continue in the coming months.
Even Bitcoin’s fall below $48,000 can’t shake these diamond hands
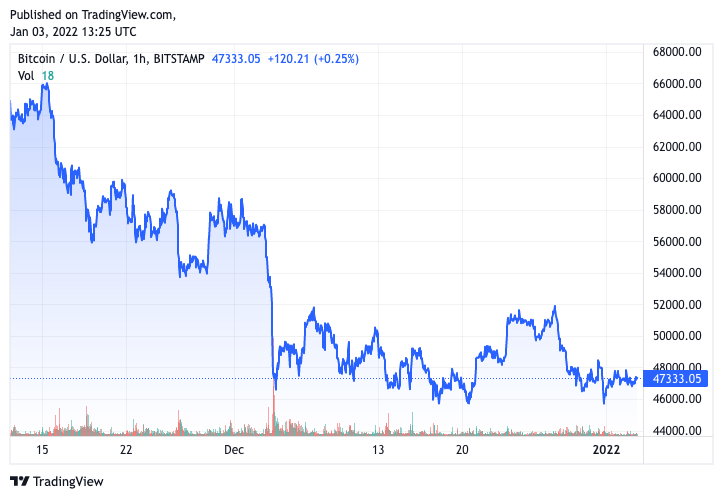
After reaching its all-time high of almost $69,000 at the beginning of November, Bitcoin has been on a slow and steady slump, ending the year at an unstable $45,500. And while it managed to recover slightly at the beginning of the week, it still shows no signs of breaking through the crucial $50,000 resistance soon.

However, Bitcoin’s declining price hasn’t caused a massive sell-off. According to the latest data from analytics company Glassnode, an increasing number of people are hodling their bitcoins and don’t plan on selling them any time soon.
In the past week, more BTC went out of exchanges than in, resulting in a negative net flow of over $425.6 million.
🚨 Weekly On-Chain Exchange Flow 🚨#Bitcoin $BTC
➡️ $8.5B in
⬅️ $8.9B out
📉 Net flow: -$425.6M#Ethereum $ETH
➡️ $5.0B in
⬅️ $4.4B out
📈 Net flow: +$597.1M#Tether (ERC20) $USDT
➡️ $5.1B in
⬅️ $6.4B out
📉 Net flow: -$1.3Bhttps://t.co/dk2HbGwhVw— glassnode alerts (@glassnodealerts) January 3, 2022
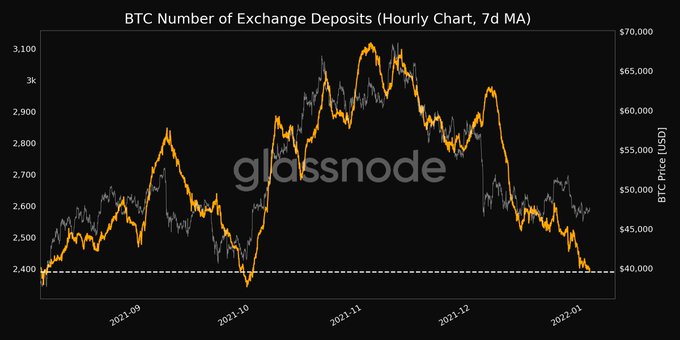
The number of transactions depositing Bitcoin into exchanges has also decreased significantly, reaching its 3-month low of 2,390 on January 2nd.

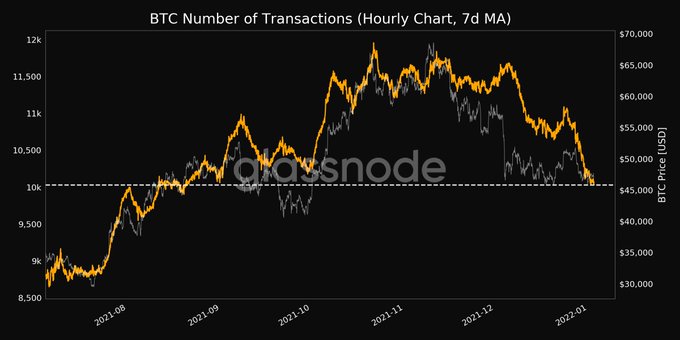
The overall number of transactions on the Bitcoin network also reached its 4-month low of just over 10,000 at the beginning of January. The trend looks like it will continue its downward trajectory, data showed.

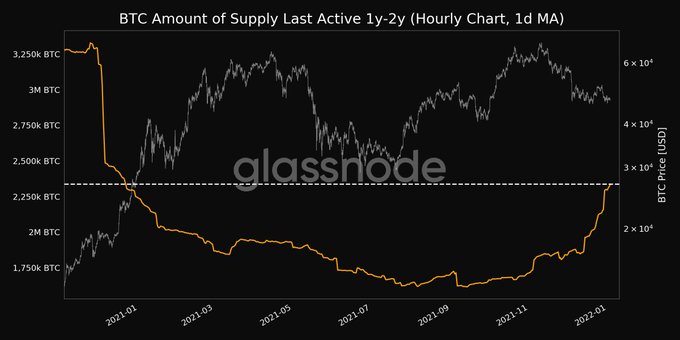
And while more and more bitcoins seem to be standing still in the past several weeks, the overall trend of hodling isn’t anything new. The amount of supply that was last active between one and two years ago reached a 1-year high of over 2.3 million BTC on January 3rd. meaning that over $110 billion worth of Bitcoin hasn’t been touched at least for a year.


