Long BTC liquidations dominated majority of 2022
270,000 long Bitcoin positions were recorded since January 25, as opposed to 159,000 short ones.

Cover art/illustration via CryptoSlate. Image includes combined content which may include the use of AI tools.
Long Bitcoin (BTC) positions were much more dominant in 2022 than short ones, according to CryptoSlate's analysis of glassnode data.
Since Jan. 25, there were 270,000 long and 159,000 short BTC liquidations this year.
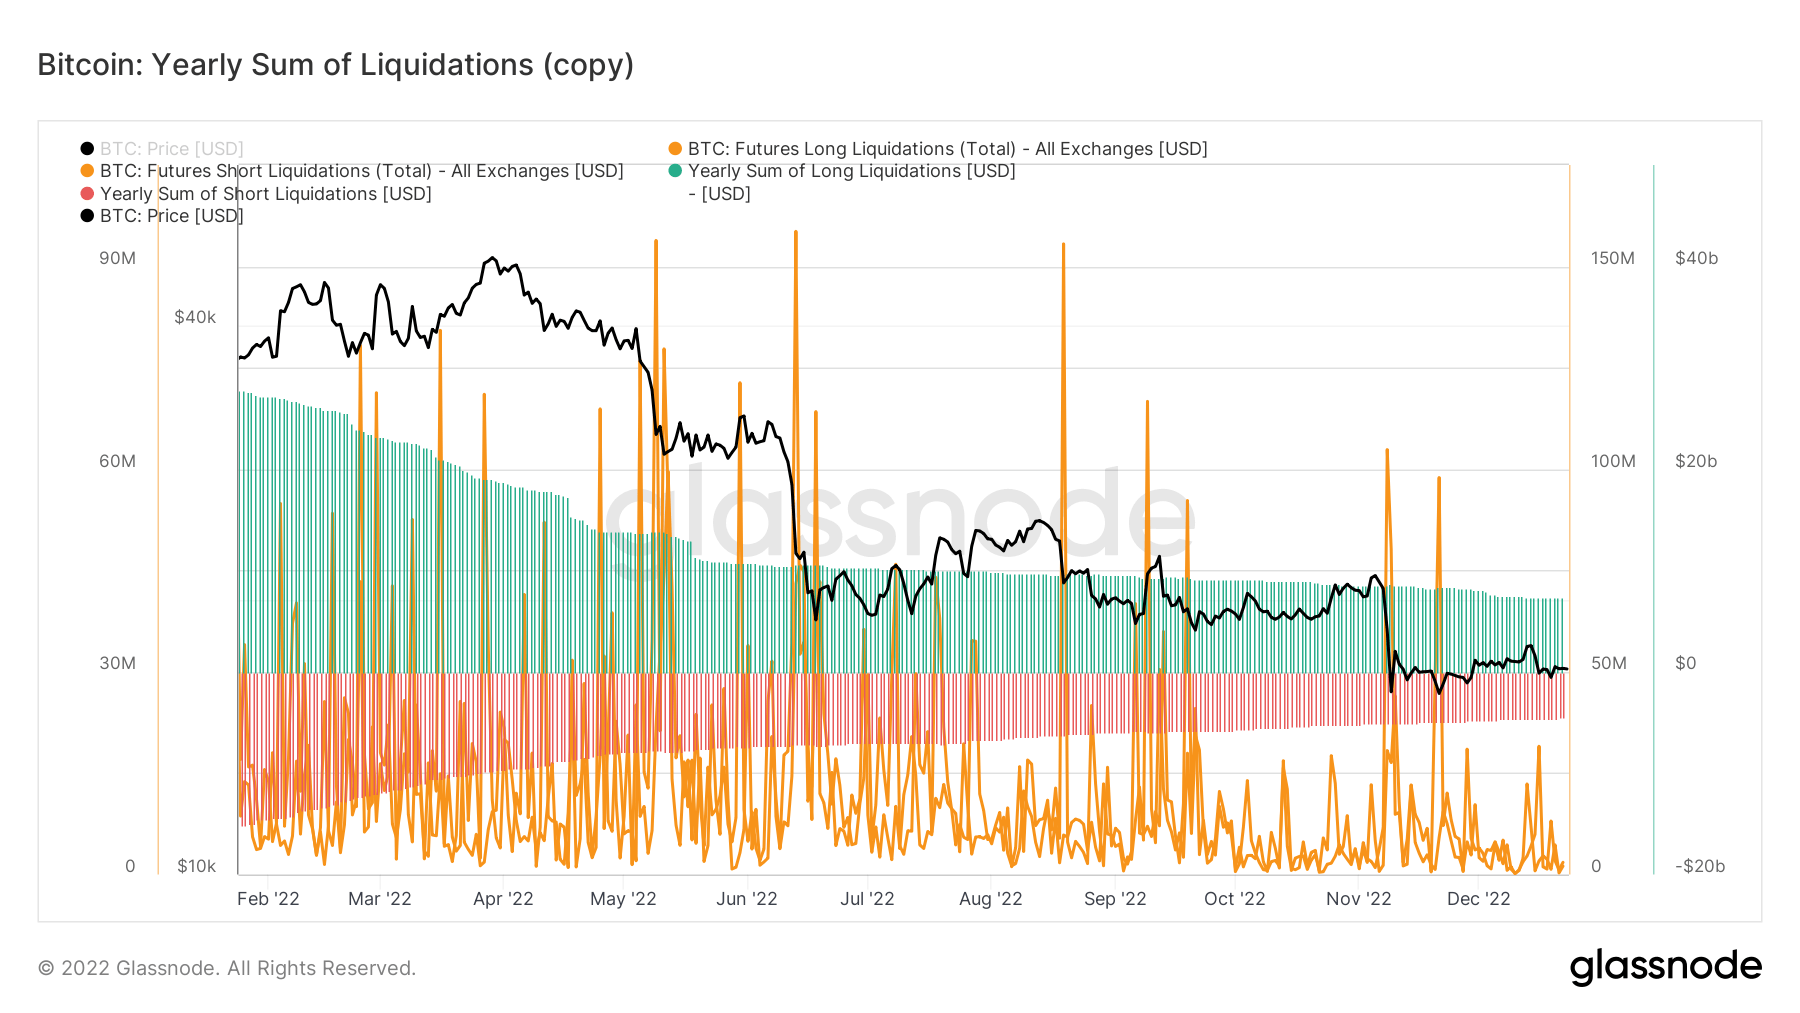
The chart above demonstrates the sum of all BTC liquidations across all exchanges. The green areas represent the yearly sum of long liquidations, while the red ones stand for the total number of short liquidations. Investors showed a tendency to invest in long-term positions and kept liquidating throughout the year.
It can be said that this year's catastrophic events, like the collapse of Terra and FTX — as well as macro events like the Russia-Ukraine war — have played a role in the behavior of investors.
CryptoSlate's analysis revealed that the long BTC positions grew exponentially after the Terra collapse — which started the bear market. Numbers from October show that long-term BTC holders started to liquidate towards the end of the month.
Long liquidations dominance
The long liquidations dominance also supports the findings above. The chart below shows the percentage of long liquidations since Jan. 25.
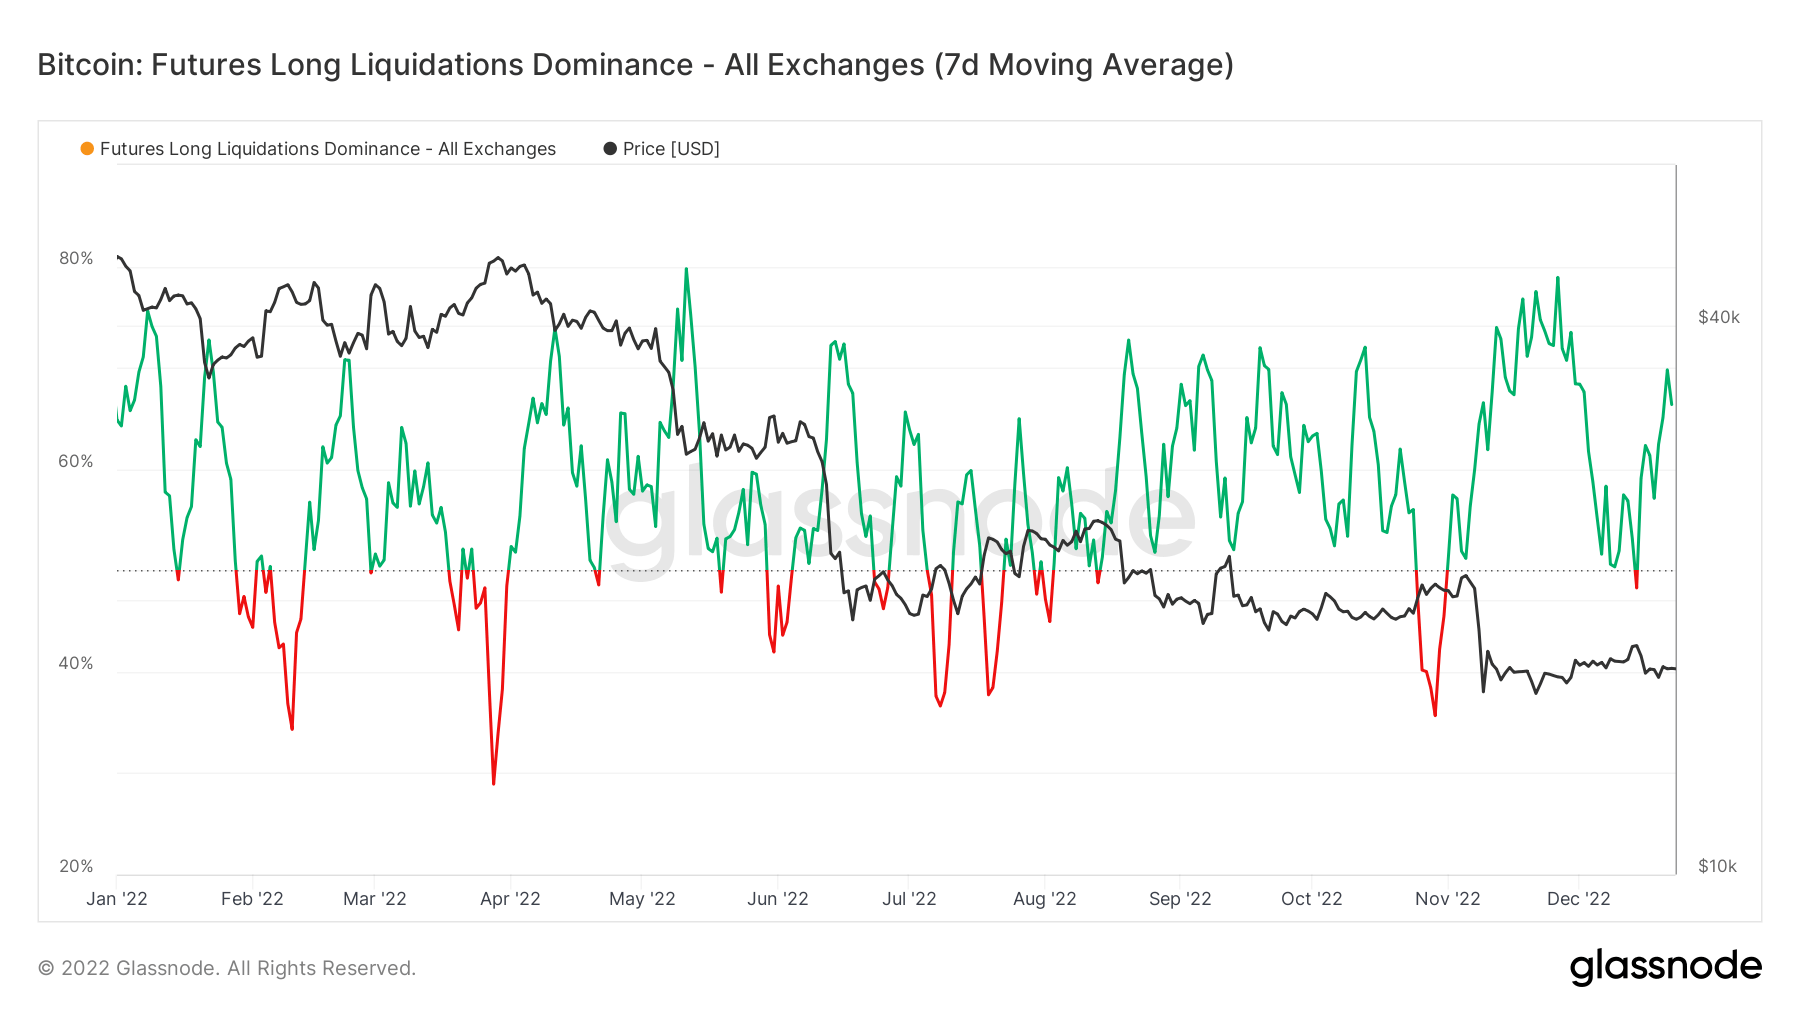
The percentage of short liquidations is calculated by dividing the number of long liquidations by the sum of both long and short liquidations. If the metric is at 50%, this indicates that there have been an equal amount of long and short liquidations. If it appears below 50%, this means that more shorts have been liquidated.
If the metric is above 50%, like the majority of the chart is, it indicates dominance in long-term liquidations. According to the chart, long-term liquidations have been dominant throughout the year except for short periods in February, April, July, and November.