Bitcoin could break $20,000 and reach new all-time highs, analysis from top traders

Cover art/illustration via CryptoSlate. Image includes combined content which may include the use of AI tools.
Bitcoin broke above the $10,000 milestone, and just as Fundstrat Global CEO Thomas Lee predicted, investors seem to be entering a “FOMO” phase that could take BTC into a massive rally similar to what happened in the 2017 bull market.
Taking a step back, with $BTC #bitcoin at new 2019 highs, don’t those old highs look like a few FOMO days away?
Crypto winter is over… pic.twitter.com/1neKiEzaFA
— Thomas Lee (@fundstrat) June 16, 2019
This technical analysis will explore different indicators that could be signaling whether the bull market has started and where the market valuation of Bitcoin could go next.
Bitcoin Technical Analysis
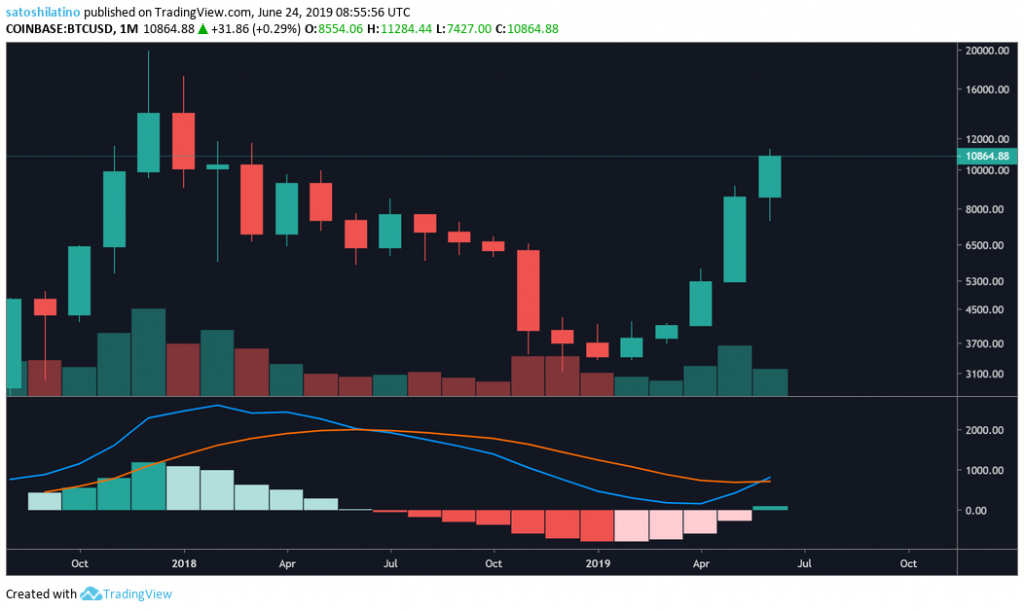
The Moving Average Convergence Divergence (MACD) is commonly used by traders to follow the path of a trend and calculate its momentum. A cross of the fast line, the 12-month exponential moving average—above the slow line, the 26-month exponential moving average, indicate a shift in momentum suggesting that an upswing is likely to come. Conversely, when the 26-month EMA crosses above the 12-month EMA, a correction could be expected.
Following the high of December 2017, when Bitcoin hit almost $20,000, it went through a deep correction that started in early January 2018. I began making lower lows and lower highs with the MACD to having a bearish crossover in July. Five months later, BTC broke below $6,000 to reach a low of $3,150 by the end of 2018.
Since the beginning of 2019, Bitcoin has gone through a 225 percent upswing that has taken its market valuation back above $10,000, resulting in a bullish MACD crossover on the 1-month chart.
What recognized traders say
@FlibFlib, a popular technical analyst on Twitter, recently pointed out that this is the third time BTC experienced a bullish MACD cross on the 1-month chart since it was released. The first time was around June 2010, which took it through a 22,600 percent bull market from $5 to $214, and the second one happened in December 2015 that saw BTC rise 5,600 percent from $350 to $19,770.
Bitcoin is about to have its third monthly bullish MACD cross of all time.
Its worked out pretty well in the past. ? pic.twitter.com/5UtrPJPsGL
— fil₿fil₿ (@filbfilb) June 20, 2019
Along the same lines, Peter Brandt, a 40-year trading veteran, explained that the way Bitcoin’s market valuation has been behaving since its inception based on the 1-week chart lead him to believe that its ten year tenure can be divided into three parabolic advances: the first one started in July 2010 when it was trading around $0.05 and reached a high of $24.15 in January 2011; the second parabolic move took over two year to develop from the low of $2 on October 2011 until the high of $1,142 on November 2013; and the third upswing was the most recent one that began in January 2015 taking BTC from $164 to $19,770 by December 2017.
Brandt believes that Bitcoin could have entered a fourth “parabolic phase” on December 2018 when it reached a low of $3,150 and could be aiming for a high of $100,000.
Bitcoin takes aim at $100,000 target. $btcusd is experiencing its fourth parabolic phase dating back to 2010. No other market in my 45 years of trading has gone parabolic on a log chart in this manner. Bitcoin is a market like no other. pic.twitter.com/wE4j3riMgI
— Peter Brandt (@PeterLBrandt) June 22, 2019
This new “parabolic advance” could actually be the reason why the sell signals given by the TD Sequential Indicator on the 1-week chart are invalid.
Bearish signals in the bull market
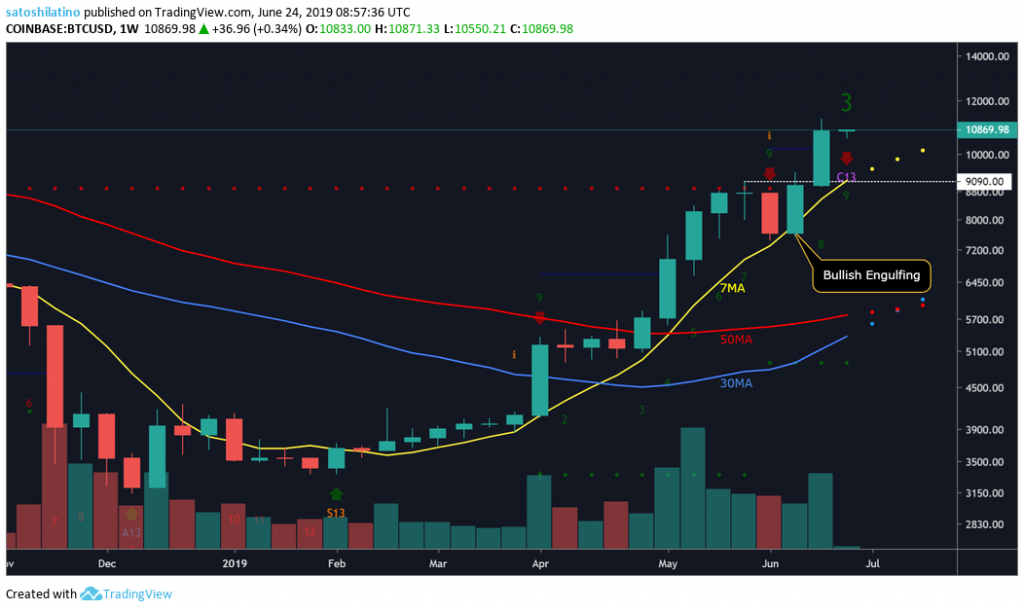
The most recent bearish sign was immediately refuted by a bullish engulfing candlestick pattern that occurred when a green candle completely overtook the body of the previous red candle. This is considered a reversal formation that combined with a bullish signal that took place when a green two candlestick began trading above the preceding green one, per the TD Sequential Indicator, took BTC to break above $10,000 to make new yearly highs.
Now, that Bitcoin is trading on a green three candlestick and there is potential for another 6 weeks of upside momentum before a sell signal—in the form of a green nine—as given by this technical index, adds credibility to Peter Brandt’s long-term idea.
Nonetheless, the current candlestick is also a combo thirteen candle, which is a bearish sign indicating that BTC could be about to retrace, and despite Brandt’s bullish predictions, the 40-years trading veteran admitted that the market is entering a fear-of-missing-out (FOMO) period that could indeed trigger a correction.
The "Obnoxious-Twitter-Millennial-Index" (OTMI) is registering extreme FOMO. That is always a sign to consider taking some money off the table. pic.twitter.com/t0t1NVo3Ys
— Peter Brandt (@PeterLBrandt) June 22, 2019
Since the previous sell signals by the TD Sequential Indicator have all been invalidated, the support given by the 7-week moving averages could be used to determine whether the parabolic move will continue or if it will be paused momentarily. So as long as BTC remains trading above the 7-week moving average, the uptrend is likely to remain intact, but breaking below it could set the stage for a pullback.
The Fibonacci retracement indicator—which is composed of horizontal lines that refer to areas of support and resistance associated with a percentage based on how much of a prior move the price has retraced—could help identify how high Bitcoin could go before it retraces and the different price points that could act as barriers on the way down due to the high concentration of demand around them.
Based on historical data, @IamCryptoWolf believes that a similar scenario to what happened around June 2016 could play out. Bitcoin could rise up to the 61.8 percent Fibonacci retracement level before it actually pulls back and the 38.2 percent Fibonacci retracement level could act as strong support.
Bitcoin. Destroyed the 38.2 fib, Next target the 61.8 according to bitcoin history. pic.twitter.com/yGLCcBhYrX
— CryptoWolf (@IamCryptoWolf) June 22, 2019
If that is the case, BTC will have to first break above the 50 percent Fibonacci retracement area that sits around $11,500 with enough volume to rise another $2,000 and reach the 61.8 percent level at $13,500, which could be used as a “take profit” point for many traders who will influence the selling pressure and take this cryptocurrency down to $9,600, where the 38.2 percent Fibonacci is.
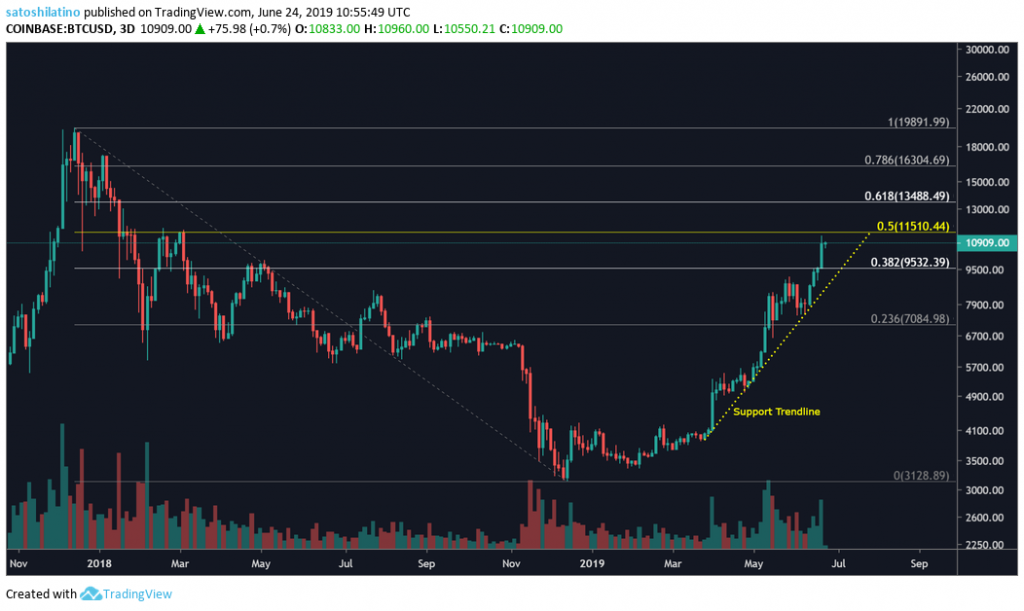
Therefore, the 50 percent Fibonacci retracement level represents a pivot point that many traders are watching closely. @MindTrader, for instance, suggests that this price point poses “tough resistance” and that in order to get to $13,500, Bitcoin will have to slice through it. Otherwise, it will abruptly drop down to $8,300, to then attempt another breakthrough.
#BTCUSD (#Coinbase) $11,600 is a tough resistance, so two possibilities here, First $btcusd will straightway break out above $11600 for next Target or a sharp drop towards $8300 support then move up and break the $11,600 resistance, only time will tell. Plz RT & SHARE ??? pic.twitter.com/jIgY9p3LQM
— Mind Trader (@mindandtrading) June 24, 2019
Overall Sentiment
The bull market seems to have started and Bitcoin could be heading to new all-time highs. According to @ParabolicTrav, the timely bounce off the $3,150 bottom that this cryptocurrency had, without a prolonged consolidation period, could reflect the increasing interest in it.
The rapid move without prolonged red bottoming MUST reflect a new paradigm in onramping development. Awareness is obviously a twin factor but the onramping allows those aware to easily act, which makes demand react much stronger at bottoms when miners are at highest sell pressure
— ParabolicTrav (@parabolictrav) June 24, 2019
Although several indicators point out that a retracement is overdue, some of those who have dared to short Bitcoin in the last few weeks were liquidated, just as reflected on Binance’s first margin liquidation order that was reported by its CEO, Changpeng Zhao.
We had our first Margin liquidation today. Guess what, it was on a #BTC short.
Don't bet against bitcoin, and don't bet again b…
— CZ Binance (@cz_binance) June 24, 2019
As demand for Bitcoin continues to grow the likelihood of a break above the December 2017 high of $19,770 increases.
$28,000 still in play. #Bitcoin
— Max Keiser, tweet poet. (@maxkeiser) June 22, 2019