Research: Withdrawal price – A new way of assessing Bitcoin
Assessing the health of the crypto market requires looking at more than just Bitcoin's price.

Cover art/illustration via CryptoSlate. Image includes combined content which may include the use of AI tools.
Assessing the health of the crypto market requires looking at more than just Bitcoin's price.
Looking at the percentage of Bitcoin holders that are in profit, meaning they bought BTC at a price lower than its current spot price, is a solid indicator of future movements.
Holders that saw their BTC increase in value are more likely to sell, which could result in a market swing. Those whose holdings have depreciated in value are more likely to hold their assets, leading to buying pressure.
Called realized price, this metric has historically been a solid but not an infallible indicator for market movements.
Another way to approach the realized price is to focus on exchange withdrawals. Namely, looking at the average price at which Bitcoin was withdrawn from exchanges provides a much more reliable estimate of a market-wide cost basis for BTC.
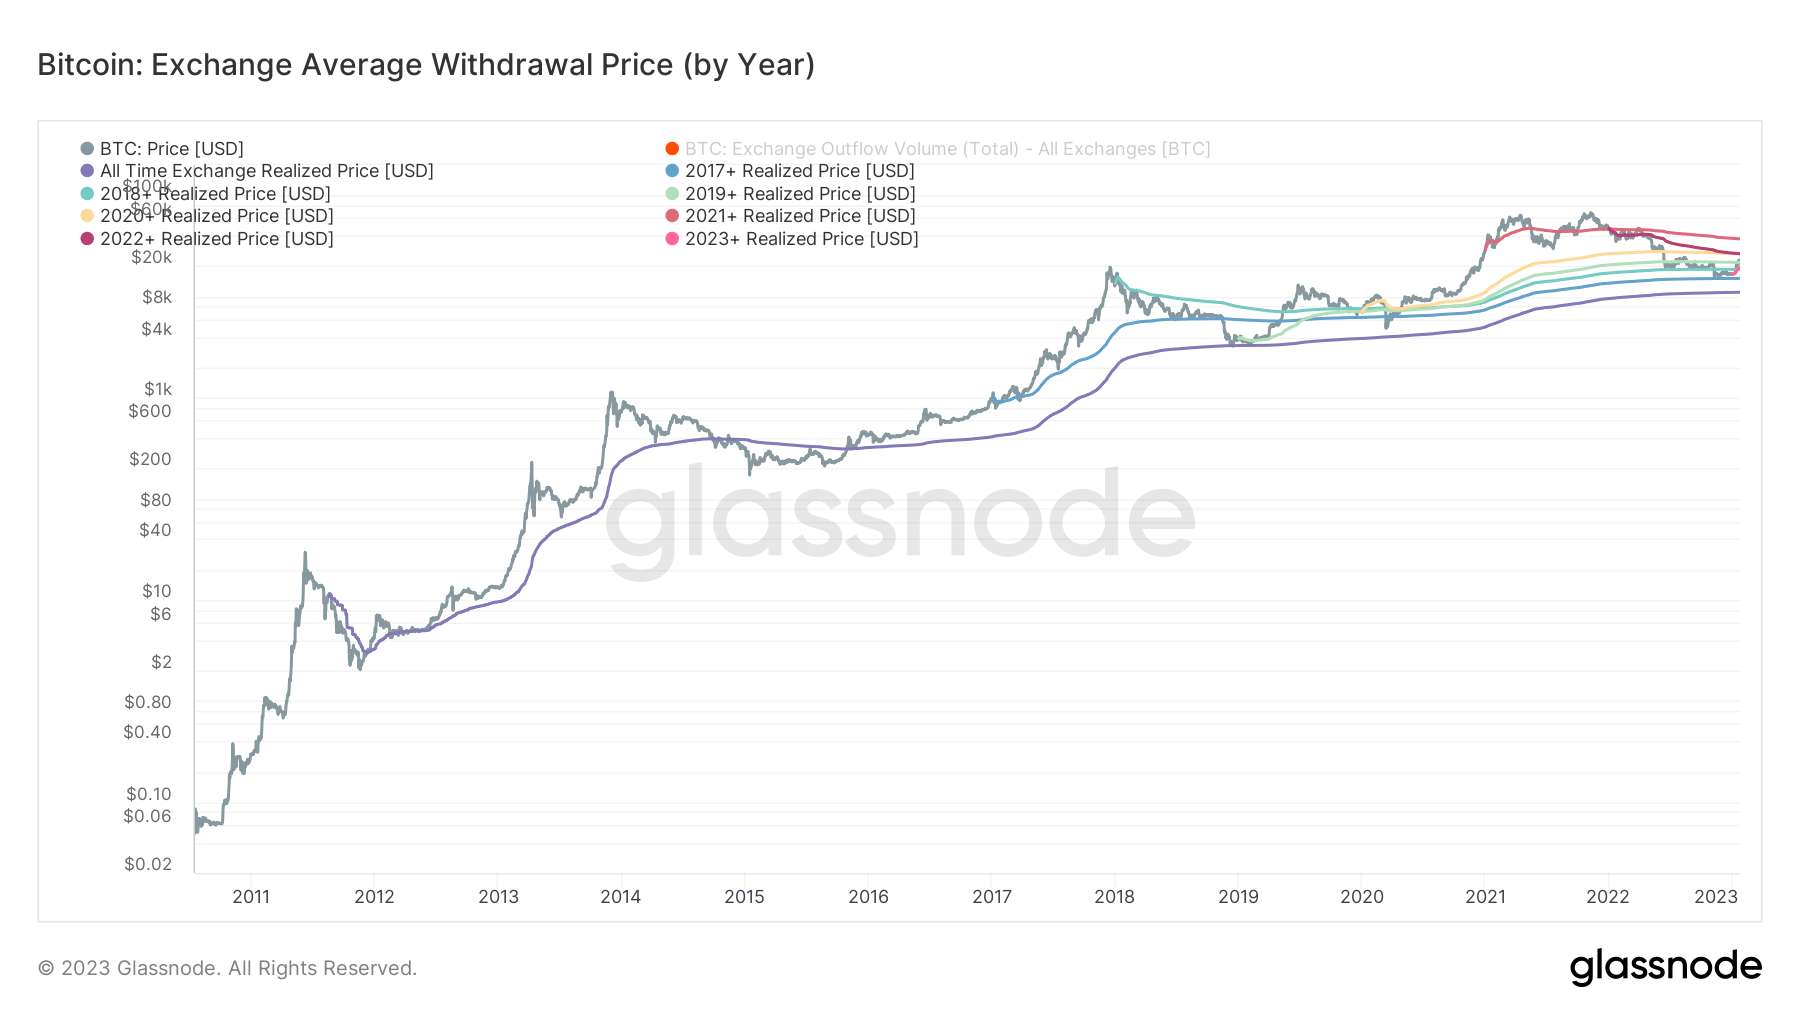
CryptoSlate analysis looked at the average withdrawal prices for each year from 2017 to 2023 and the average withdrawal price from 2011 to 2022.
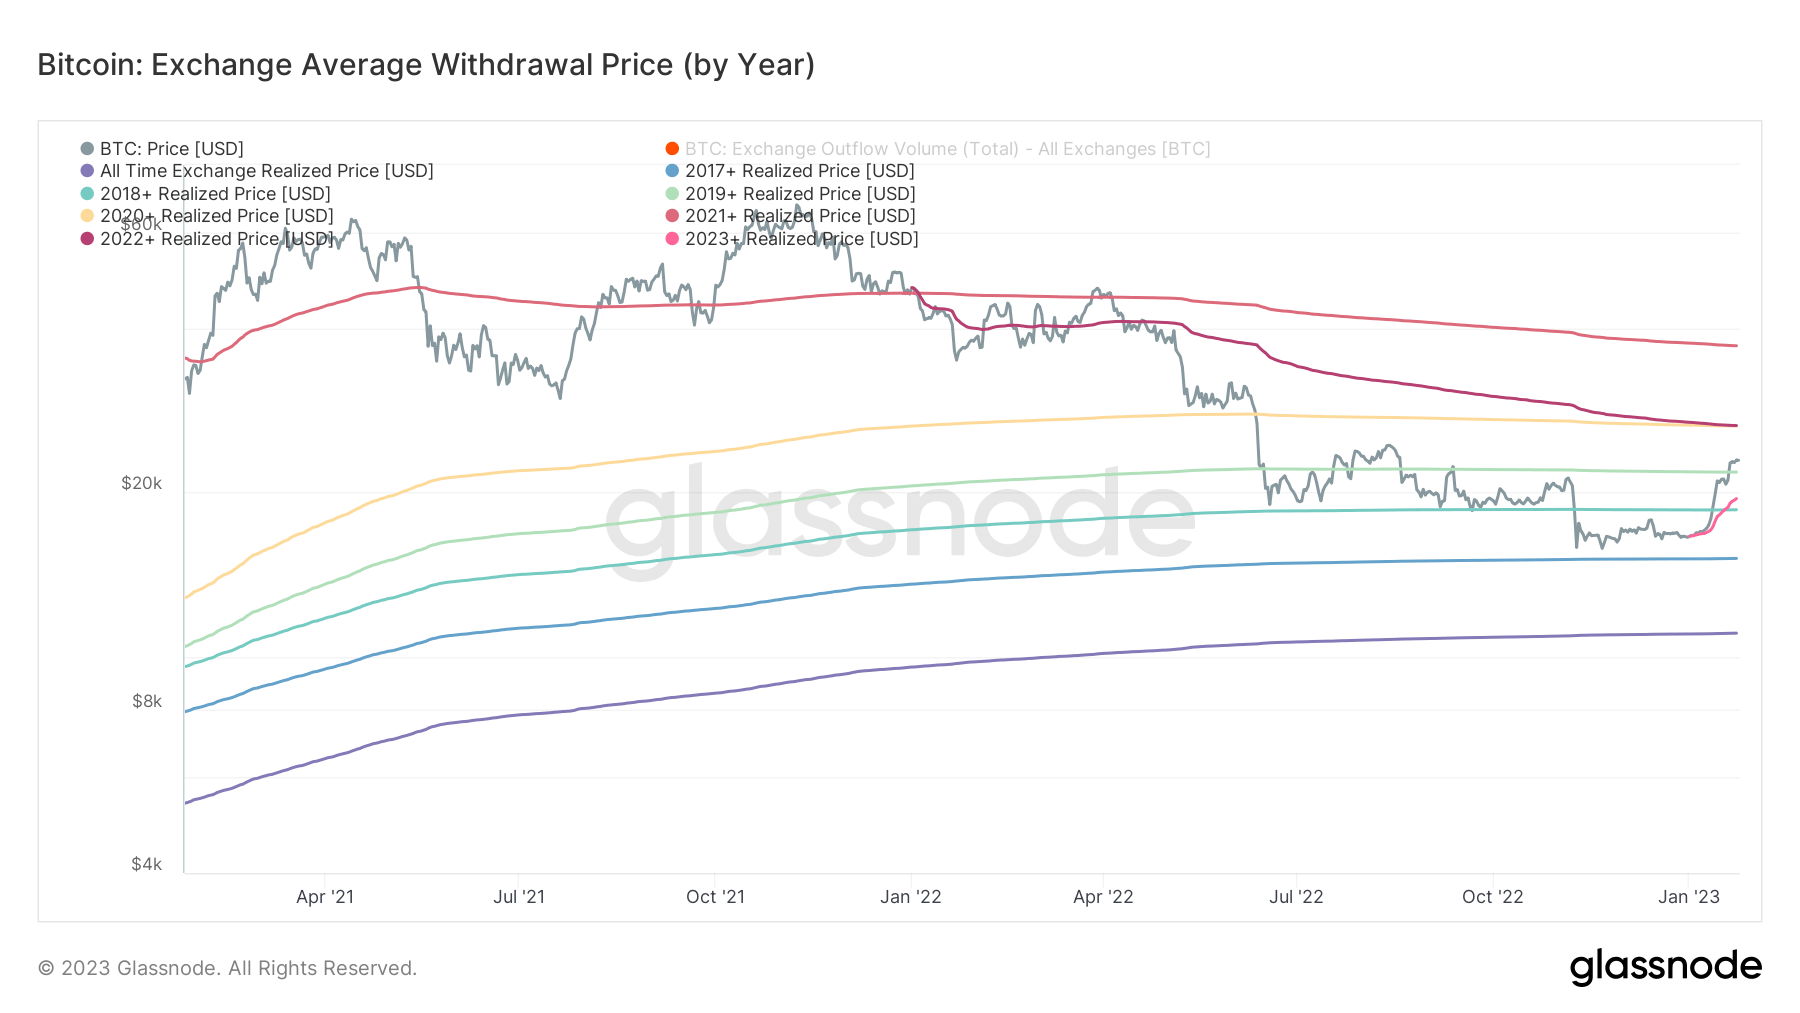
Data from Glassnode showed a curve in the average Bitcoin withdrawal price, ranging from $15,139 to as high as $37,232.
- 2017 = $15,139
- 2018 = $18,598
- 2019 = $21,817
- 2020 = $26,513
- 2021 = $37,232
- 2022 = $26,564
- 2023 = $19,496
The average withdrawal price for Bitcoin from 2011 to 2023 stands at $11,037.
When Bitcoin reached $23,000, it broke above multiple cost-basis levels, including both realized price and short-term holder realized. The long-awaited but slow recovery has now put investors that bought BTC before the COVID-19 pandemic in profit.
However, those that purchased BTC during the 2020 pandemic, in 2021, and in 2022 saw their positions lose value. Investors that bought the dip at the beginning of January 2023 have already seen profit as Bitcoin's price continued to rise throughout the month.
The average withdrawal price becomes even more important when analyzed alongside long-term holders.
Defined as those owning BTC for longer than 155 days, long-term holders are less likely to spend their coins. The realized price at which they bought BTC has historically served as a solid resistance indicator. However, the average withdrawal price for long-term holders might be an even better gauge for resistance, as it represents the average value at which they transferred their coins from exchanges to wallets.
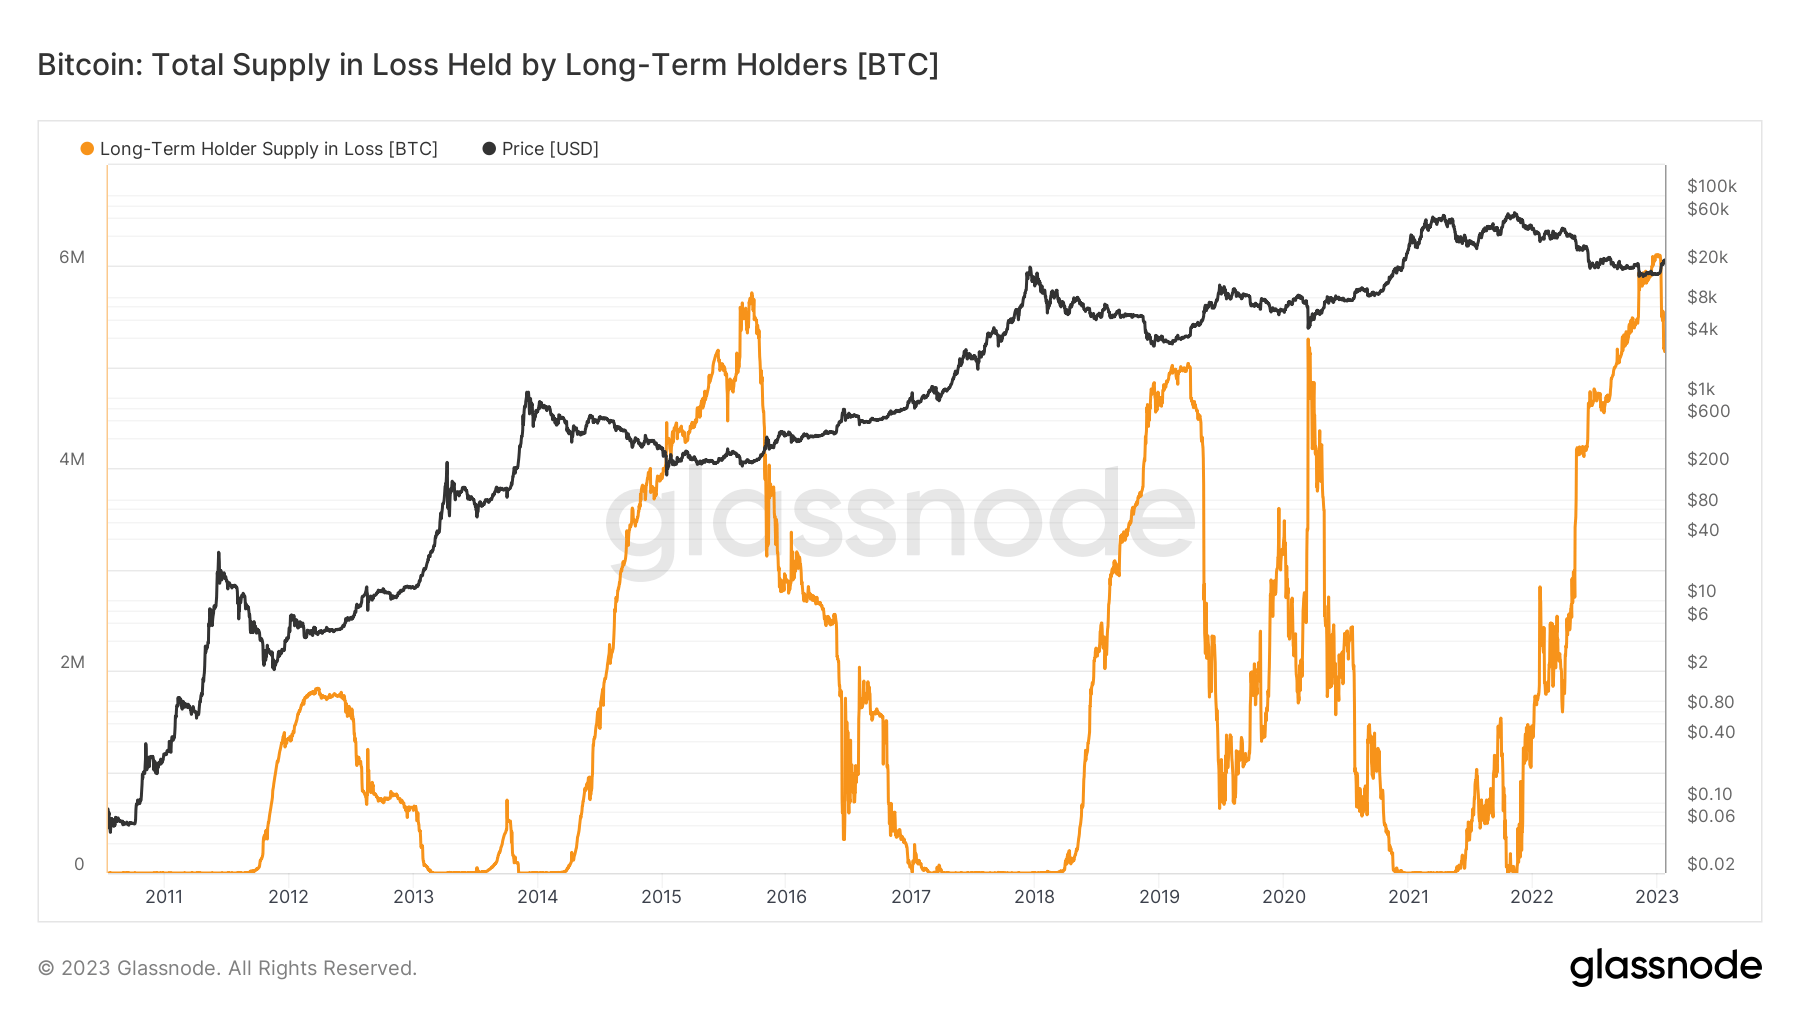
At the end of 2022, the market saw the total supply in loss held by long-term holders reach an all-time high. And while the number dropped from 6 million BTC to 5 million BTC since the beginning of the year, it still shows a significant portion of the supply at a loss.
This indicates that long-term holders could continue to sit on the 5 million BTC until their realized price is met, creating a solid resistance that could stop Bitcoin from slipping below its 2022 low.