Why one on-chain indicator shows Bitcoin could face heavy resistance at $9,600

Photo by Max Bender on Unsplash
Bitcoin’s recent rejection at $10,000 has altered its market structure, despite it being able to maintain some levels of stability within the mid-$9,000 region.
It now appears that its previous consolidation channel around $9,700 has become a heavy resistance region, and on-chain data shows that this level may not be easily surmounted in the near-term.
It is important to note that the same data also shows that buyers have established the price region directly beneath where BTC is trading at as a strong level of support.
Bitcoin enters firm consolidation phase following recent volatility
Earlier this week Bitcoin incurred some immense volatility that caused it to rally to highs of $10,050 before facing a harsh rejection that led it down towards $9,000.
Buyers were able to defend against it breaking below this price level, subsequently propelling it back into the mid-$9,000 region.
It is important to note that it has not yet been able to recapture its previous position at $9,700, and this appears to have transformed into a heavy resistance level.
This consolidation phase has offered investors with mixed signals. On the one hand, period of consolidation beneath resistance during macro uptrends are typically positive signs.
On the flipside, the consecutive rejections that BTC has faced in the lower-$10,000 region, coupled with the three high time frame rejections it has seen at $10,500 over the past six months, both seem to suggest downside is imminent.
Here are the critical levels to watch: According to on-chain data
Data from IntoTheBlock’s “In/Out of the Money” indicator shows that Bitcoin does face some heavy resistance just above its current price level.
The analytics platform spoke about this in a recent tweet, explaining that a significant amount of wallet addresses accumulated BTC around $9,600.
“Using our In/Out of the Money Around Current Price indicator (IOMAP), we see that there are 2.03 million addresses with positions around the $9,602 mark.”
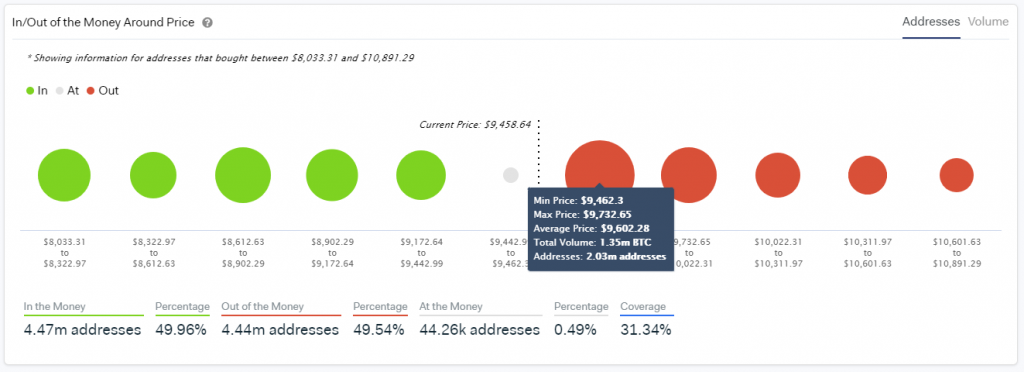
Because underwater buyers may be apt to exit their positions for a breakeven, it is possible that the crypto will face an influx of selling pressure if it is to reach this price level.
That being said, the same indicator also shows that Bitcoin does have some notable support between roughly $9,200 and $9,400. IntoTheBlock also spoke about this, saying:
“The IOMAP analysis reveals that the next level support level is between $9,172 to $9,442, where almost 805 thousand addresses bought 509 thousand BTC.”
Which of these two regions is broken through first should offer investors significant insight into Bitcoin’s mid-term trend.