Why It’s Overkill to Compare the Bitcoin Slowdown With History’s Biggest Bubble Bursts

Photo by Markus Spiske on Unsplash
Skeptics forecasted it saying the crypto crash was inevitable; die-hard crypto enthusiasts called it fear to monger with a tint of hidden agenda. Skeptics seem to be having the last laugh–for now, at least. Especially after the latest Bitcoin nosedive prompted investors to weigh the asset class with some of history’s most spectacular asset bubbles.
However, is it really that simple? Perhaps not.
Comparison With History’s Biggest Bubbles
The crypto space came under similar analysis/criticism in the past as well. And some leading financial publications comparing the Bitcoin plunge with some of history's biggest bursts did so back in 2014 too.
Bitcoin passed $1,000 towards the end of November 2013 and climbed up to around $1,200 before retreating to the $340–$530 range by April 2014. This prompted some analysts to draw a parallel to the South Seas Bubble.

The South Seas Bubble refers to the spectacular crash of the stocks of U.K.-based South Sea Company. During its peak stocks of the company went upward of £1,000 (unadjusted for inflation), before crashing to nearly nothing by H2 1720.
The crypto space remained relatively humble over the next couple of years with a steady, moderate growth. However, that would soon change starting Jan. 1, 2017, when Bitcoin passed the $1,000 milestone once again after nearly three years. And by the end of 2017, it attained an all-time high of over $20,000.
Flogging a Dead Horse
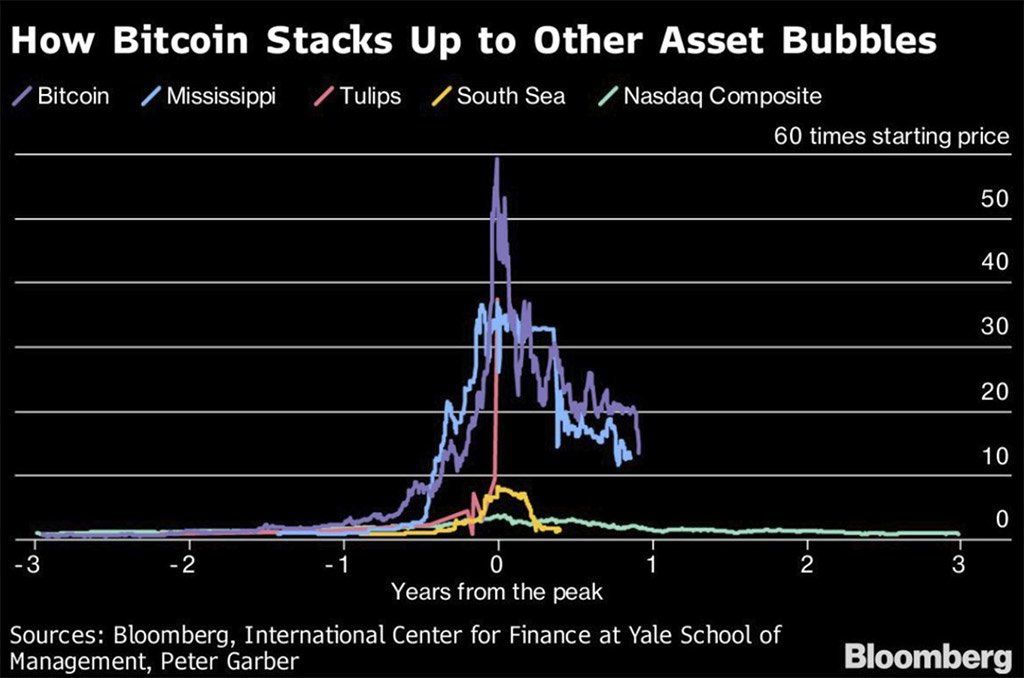
After the recent plunge in Bitcoin prices, similar reports have begun surfacing wherein analysts are comparing the currently downward spiral of the crypto market with bubble bursts such as Tulip Mania, South Sea Bubble, and Wall Street Crash of 1929, among others.

Sure, the crypto market is down today compared to late-2017 with Bitcoin price hovering in between $4,000 to $4,500 as of press time. However, the year-on-year.
But even with the current slow down taken into account, most of these analyses seem to have conveniently forgotten to draw a comparison between the current bubble and the one from 2014.
Is this a bubble within a bubble? A double-bubble, maybe? (Like some Twitter users are calling it here.)
The real question is: have there been assets with multiple bubbles?
— JP Bartley (@JP_Bartley) November 22, 2018
The bottom line here would be that unlike the other bubbles these analysts have referred to, the so-called Bitcoin bubble doesn’t seem to burst into oblivion. If the recent past has taught us anything, it is likely that Bitcoin prices will eventually correct and reaches an equilibrium before going stronger again–just like it did in 2014.