The case for Bitcoin as a hedge against inflation
The Bitcoin inflationary hedge narrative is unraveling, however, Bitwise analysis shows all is not lost just yet.
Cover art/illustration via CryptoSlate. Image includes combined content which may include the use of AI tools.
Bitcoin has long been touted as an inflationary hedge. Proponents argue that government-issued fiat currencies decrease in value over time due to money printing by central banks. But Bitcoin doesn't suffer the same devaluation as supply is fixed at 21 million tokens.
However, now that inflation is here and making its presence felt, BTC has, so far, failed to live up to expectations.
In April, data compiled by Bloomberg showed the correlation between the S&P 500 and Bitcoin is the highest it has ever been. Indeed, since the beginning of the health crisis, the two have been moving in unison.
A recent Bank of America report echoed this view. Analysts Alkesh Shah and Andrew Moss said recent Fed rate rises to combat inflation have led to drops in Bitcoin's value, alongside stocks.
Based on this, it seems that the dollar remains king in times of crisis. But is it as cut and dry as that?
Money printing is out of control
The US Consumer Price Index for April fell 0.2% from the previous month but remains close to record 40-year highs at 8.3%. It's much the same in the UK, with the latest government figure at 9%.
In response, UK Chancellor Rishi Sunak sought to blame the issue on “global challenges,” adding that the government will provide “significant support where we can” to combat the cost of living crisis.
“We cannot protect people completely from these global challenges but are providing significant support where we can, and stand ready to take further action.”
Global challenges refer to the ongoing effects of the health crisis, the war in Eastern Europe, and the supply chain breakdown. But no politician has spoken about the primary cause of inflation – money printing, which is entirely under central banks' control.
Although it's been widely publicized that central banks have printed like crazy since the beginning of the health crisis, the chart below of the Fed M1 money supply illustrates the scale of the problem.
“M1 is the money supply that is composed of currency, demand deposits, other liquid deposits—which includes savings deposits. M1 includes the most liquid portions of the money supply because it contains currency and assets that either are or can be quickly converted to cash.”
From February 2020, the US M1 money supply was at $4,003 billion. But what followed was a near-vertical increase to $16,564 billion by June 2020.
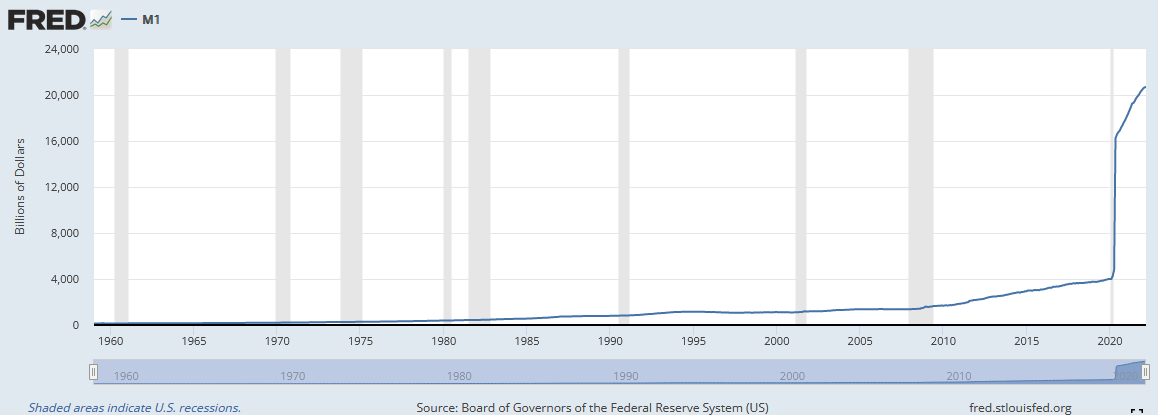
Production output and money supply should be moving in lockstep for a healthy economy. However, the M1 money supply far outstrips production output, leading to an oversupply of money chasing the same, if not fewer, goods and services.
The likely outcome of a loose monetary policy is a recession. The question is, how deep and painful will the coming downturn be?
True inflation
Inflation is not the single leading cause of a recession. There are also factors to do with high-interest rates, low consumer confidence, and tight credit.
Nonetheless, all of the factors listed above have a strong interrelation with each other, in that changes in one impact the others. For example, rising inflation will be met with increased interest rates, leading to difficulties in obtaining credit and a cut back in spending and general confidence.
Mainstream media has reported that inflation is the highest in 40-years. But because the methodology used to calculate the Consumer Price Index (CPI) has changed over the years, inflation today is understated compared to previous decades.
“According to the BLS, the changes removed biases that caused the CPI to overstate the inflation rate. The new methodology takes into account changes in the quality of goods and substitution.”
ShadowStats.com calculates inflation using the same methodologies used in 1990 and 1980. The 1980 methodology chart shows that inflation is currently at 16%, twice the reported figure.
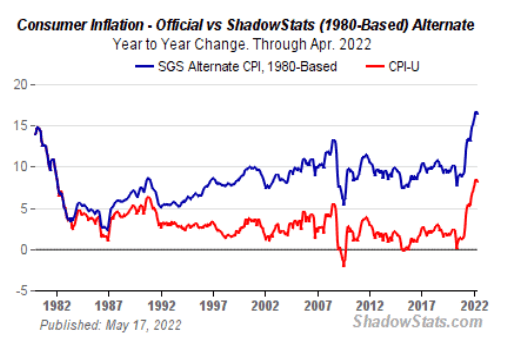
And, when taking into account food and energy, which are excluded from the CPI figures due to being “more volatile,” the actual situation is worse than any politician would dare to admit publically.
What about the relationship between Bitcoin and inflation?
Fear is the overriding narrative, and investors are looking for safety. As witnessed by BTC's decline since Q4 2021, it seems Bitcoin isn't that shelter from the coming storm.
Indeed, its late performance has led many, maxis included, to question if Bitcoin is an inflation hedge, a risk-on asset, or perhaps something else entirely.
David Lawant, the Director of Research at Bitwise Asset Management, makes the case that Bitcoin should be thought of as an “emerging monetary asset and hedge against inflation.” He adds that the leading cryptocurrency has been “making remarkable progress in establishing itself as such.”
But how can that be?
Lawant argues that measuring the sensitivity of asset returns against inflation is a challenging task to undertake.
“Among many challenges, perhaps the most relevant is that inflation indices like the CPI reflect past data; they are most relevant to market price action only to the extent that they change future expectations. Another problem is that they only come once a month, which gives us a relatively small sample size to work with.”
One way to overcome this obstacle is using the breakeven inflation rate. Lawant explains that this is derived by looking at the difference between two equivalent assets that differ by whether they offer inflation protection. He charted the Bitcoin price against the five-year inflation breakeven rate, and the results show a somewhat correlated relationship.
Lawant points out that the five-year breakeven inflation and Bitcoin price bottomed during the health crisis. Similarly, April and November 2021 BTC highs showed approximate local tops in the five-year breakeven inflation rate.
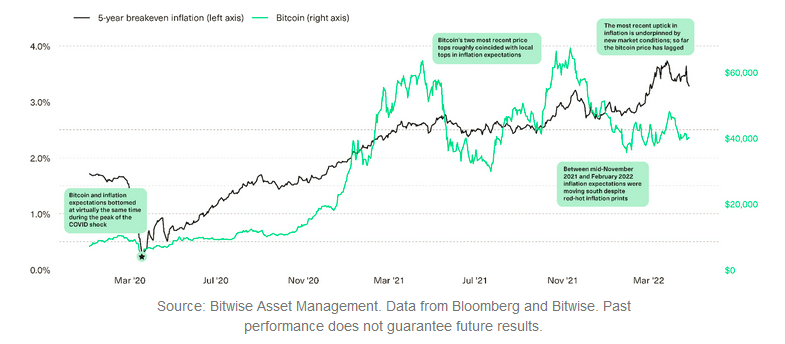
However, 2022 has seen a clear divergence between the two, with Bitcoin seemingly lagging. This lag is attributed to the Ukraine-Russia war and market fears of rate rises, which alter the relationship between inflation expectations and risk asset returns.
“Under this backdrop, the relationship between changes in inflation expectations and risk asset returns has been turning more complex.”
What we've seen under these conditions is rising prices in some commodities, while growth stocks have suffered. Lawant said he thinks Bitcoin lies somewhere in between these extremities.
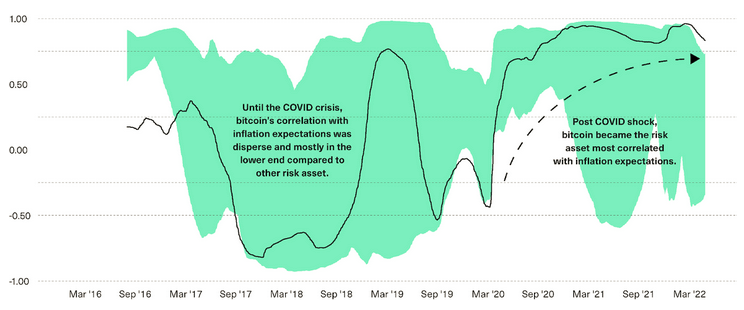
The chart below shows the correlations between changes in inflation expectations and Bitcoin returns (in black) against 13 other risk assets such as equities, bonds, commodities, and real estate (aggregated in green shading).
September 2019 to March 2020 saw Bitcoin as the asset least correlated with market inflation expectations, moving through to the most correlated at present.
“In our view, the most likely explanation for this shift is an increasing number of market participants—from macro investors, corporations, and insurance companies to financial advisors—recognizing bitcoin’s role as a potential inflation hedge.”
Lawant makes a convincing case that all is not lost for Bitcoin's inflation hedge narrative. But, with everything said, it boils down to raw price data, and until the price climbs higher significantly, doubts about this narrative will continue to linger.