Indicators showing Bitcoin’s uptrend could be interrupted by a major correction

Cover art/illustration via CryptoSlate. Image includes combined content which may include the use of AI tools.
Although the longer-term indicators point to the beginning of a bullish trend that could take BTC to new all-time highs, the shorter-term timeframes indicate a Bitcoin correction is overdue.
Since the low of December 2018 when Bitcoin was trading at $3,130, BTC experienced a strong upswing that has taken its price to almost $14,000, leading investors to believe that a parabolic phase has started. With strong upward leaps in price come similarly jarring corrections.
Bitcoin technical analysis
In the macro-perspective Bitcoin looks bullish, even though institutional investors have not formally entered the market. Fidelity Investments is yet to launch its cryptocurrency trading service, as well as Bakkt, TD Ameritrade, and E*Trade, as the economist and financial analyst Alex Krüger pointed out, which could be the catalyst that takes BTC to higher highs.
Fundamentally, many bullish catalysts still ahead: Fidelity, Bakkt, Ameritrade, Etrade. Bakkt would begin testing its futures Jul/22. Retail interest is steadily climbing, and so is institutional interest, which has been piqued due to $BTC's performance and macro narratives. pic.twitter.com/vSXJglkqyO
— Alex Krüger (@krugermacro) June 29, 2019
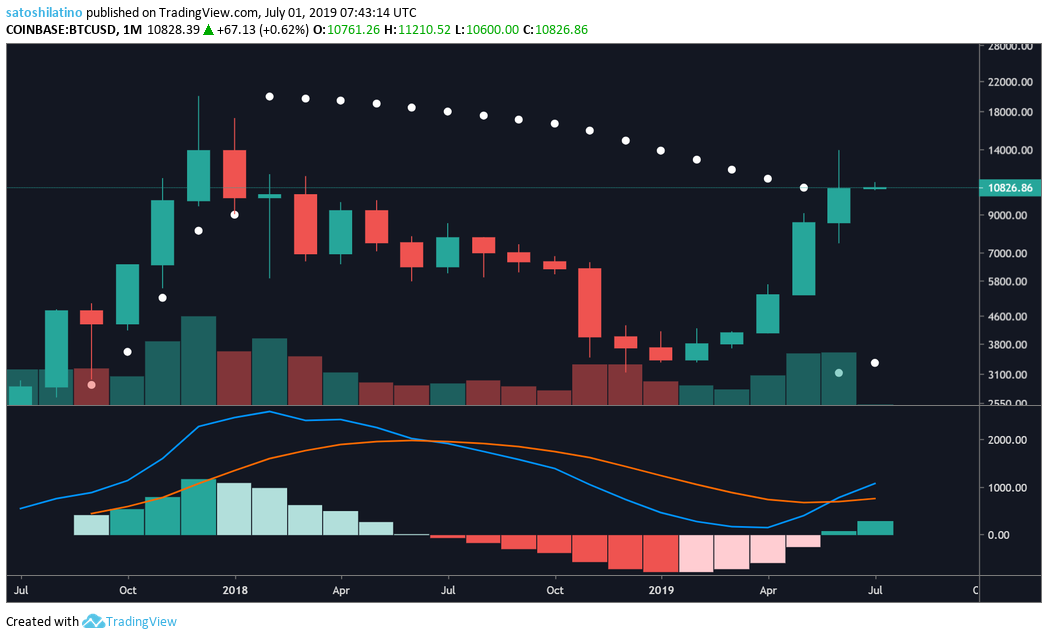
Based on the moving average convergence divergence (MACD), which is commonly used to follow the path of a trend and calculate its momentum, the move to new all-time highs has officially started since this technical indicator recently had a bullish cross between the 12-month exponential moving average and the 26-month exponential moving average.
This is the third time BTC experiences a bullish MACD cross on the 1-month chart since it was released. The first time happened around June 2010, which took it through a 22,600 percent bull market from $5 to $214, and the second one occurred in December 2015 that saw BTC rise 5,600 percent from $350 to $19,770.
In addition, the Parabolic SAR, which is displayed as a series of dots and helps identify potential reversals in the price movement of an asset to determine the direction of the trend, has positioned itself below the price of Bitcoin since last month, confirming that the bull run has begun. The last time the Parabolic SAR signaled a trend change from bearish to bullish was in June 2016 and was followed by a 3,700 percent rally that ended in the all-time high of December 2017.
Nonetheless, in the micro-perspective, it seems like Bitcoin is due for a major correction.
According to Peter Brandt, a 40-years trading veteran, the current market conditions could be compared to a bull trap—a false signal, referring to a declining trend that reverses after a convincing rally and breaks a prior support level—seen in the Nasdaq 100 around October 2000.
The analogue concept is a foundational premise of chart analysis — that forms tend to repeat, even in different time frames. Nasdaq 100 in 1999-2000 vs. BTC currently. Advance above 12444 violates possible analogue $BTC Forewarned = fore-ready pic.twitter.com/PzYr0MgG1v
— Peter Brandt (@PeterLBrandt) June 30, 2019
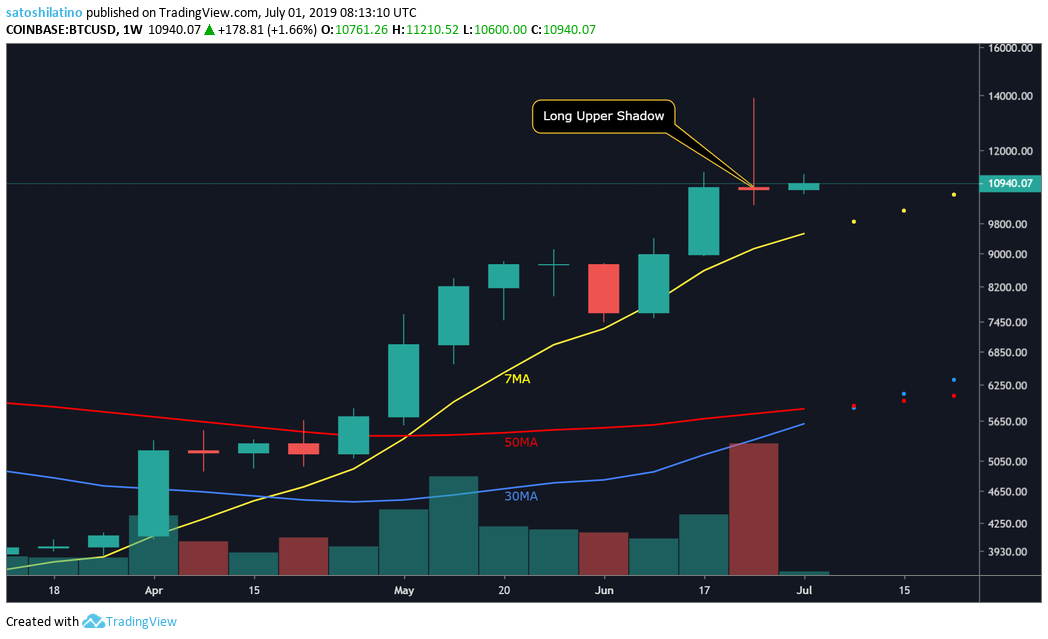
Bitcoin’s long upper shadow candlestick pattern that formed last week could be signaling that a retrace is indeed underway. This is considered an extremely bearish formation that usually takes on greater significance when the market is overbought and this market condition can be seen on the notable 340 percent bullish momentum that BTC has had since the low of December 2018 when it reached $3,130.
Therefore, if a pullback was to occur Bitcoin will have to first trade below the 7-week moving average, which has been acting as strong support since the week of February 18. Breaking below this moving average, currently sitting at around $9,600, could trigger a further decline down to the 50 or 30-week moving average. This will represent a 40-50 percent retrace, which Tone Vays, a former VP at JP Morgan Chase, agreed was needed due to the speed of the rally that Bitcoin experienced this year.
.@ToneVays Says #BTC Could Drop To 4K!
He doesn't believe the bear market is over & is waiting for a 40% correction…
?️ What are your thoughts on the #bitcoin pull back? Is the bear market really over?
? Full interview on @BloxliveTV here: https://t.co/YpdGihew8n pic.twitter.com/ZA2424FAZv
— Layah Heilpern ? (@LHeilpern) June 28, 2019
In the event of a pullback, the Fibonacci retracement indicator could help pinpoint the different price levels that could act as barriers due to the high concentration of demand around them. This technical index predicts that if BTC was to correct down to the 78.6 percent Fibonacci retracement zone, which represents a 50 percent decline from the current price level, it could find some level of support on its way down around the $9,770, $8,500, and $7,250 zones.
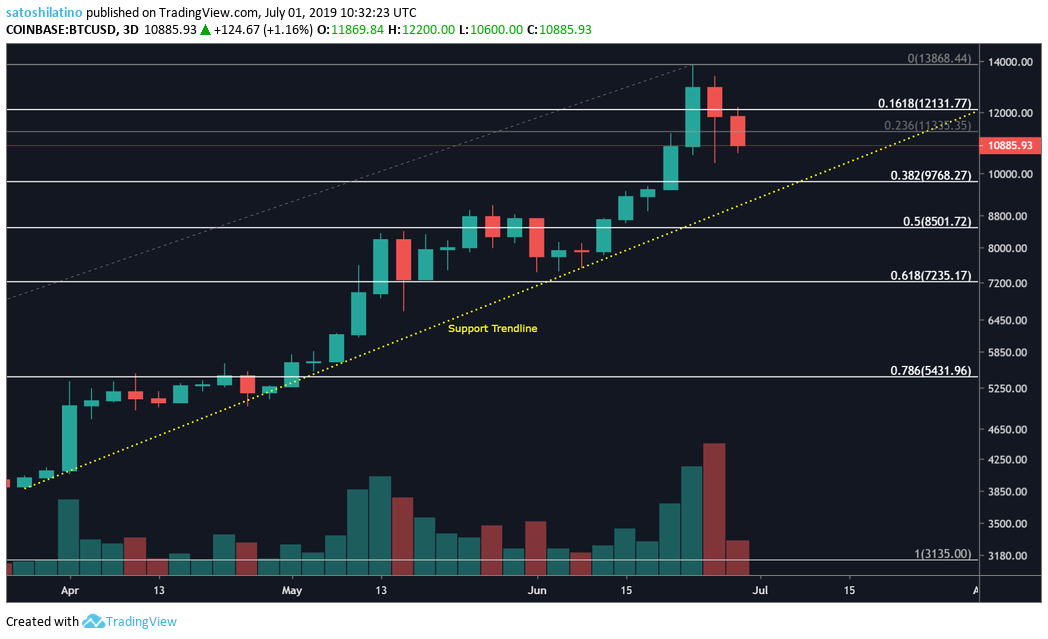
However, if the bullish trend continues and Bitcoin moves above the 16.18 percent Fibonacci, Alex Krüger, believes that the next levels of resistance this cryptocurrency will have to break are around $13,900, $15,000, and $17,400.
$BTC levels
– R: 12000, 12500, 13000, 13300, 13600, 13900-14000, 15000, 17400, 20000, moon.
– S: 11600-11500, 11300, 10800, 10300, 10000, 9600.
(levels are round numbers and Bitmex's prior highs/lows and fibs)
Also watching moving averages below.
— Alex Krüger (@krugermacro) June 29, 2019
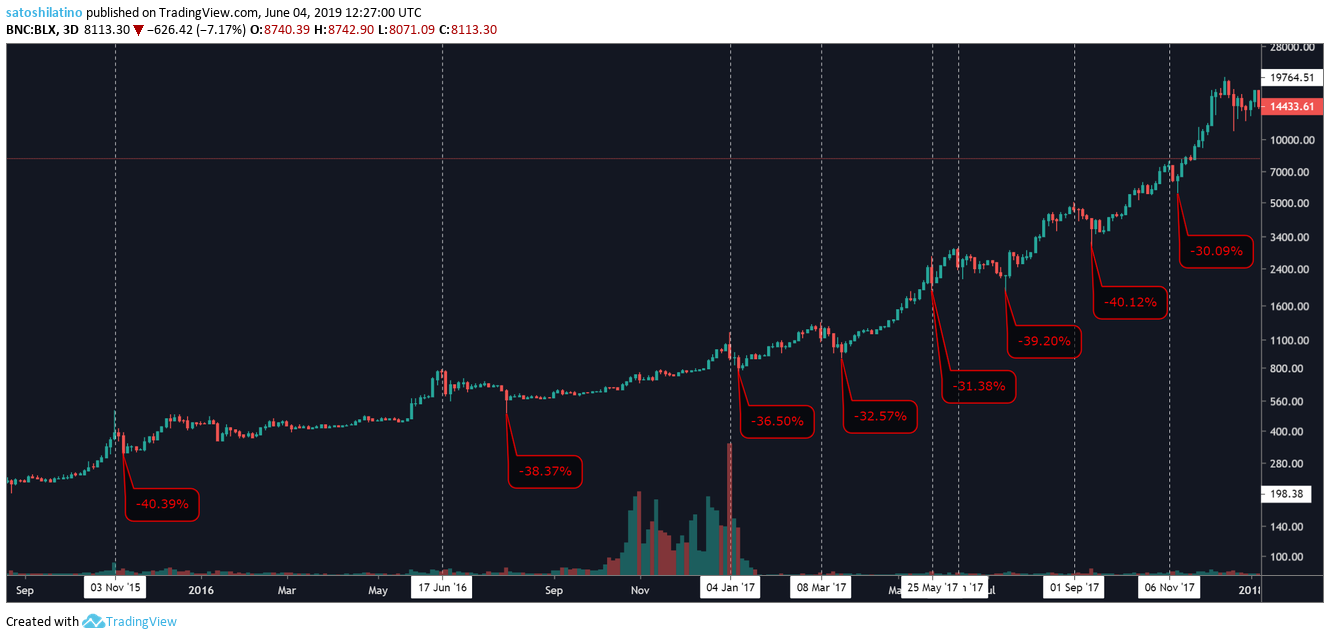
It is worth noting that 30-50 percent retracements are normal during Bitcoin’s bull markets after the major upswings that it has and they help maintain bull trend healthy. The most recent bull market that BTC had, for instance, lasted more than two years and represented 10,000 percent gains from the low of Aug. 25, 2015, when Bitcoin was trading at $198, to the high of $19,760 on Dec. 17, 2018. During this time span, there were eight significant exhaustion points.
The high of $501 on Nov. 3, 2015, was followed by a 40.39 percent pullback, while the high of $784 on June 17, 2016, experienced a 38.37 percent retrace. After an all-time high was achieved on Jan. 4, 2017, when Bitcoin was valued at $1,180 it dropped 36.50 percent. Two months after the milestone, BTC hit a new all-time high of $1,320 on Mar. 8, to then fall 32.57 percent.
Since that time BTC began reaching higher highs every couple of months. On May 25, the cryptocurrency went up to $2,746 and immediately pulled back 31.38 percent. The high of June 12 when one BTC was worth $2,985 was followed by a 39.20 percent correction. A similar pattern happened after the high of Sept. 1 and Nov. 6 that saw Bitcoin drop 40.12 and 30.09 percent, respectively.
Overall Sentiment
Despite the strong bullish trend that Bitcoin has experienced this year, it seems like its price action has been mainly influenced by retail interest. Google Trend data reveals that the amount of worldwide “Bitcoin” searches has seen a steady increase over the past 12 months, but it is not even close to what it was seen during the bull market of 2015-2017.
If Willy Woo’s study about the direct correlation between Bitcoin’s popularity and its market valuation is right, then higher highs could be expected as the search volume for this cryptocurrency rises and institutional investors become more interested, which adds credibility to the bullish signs seen in the 1-month chart.
That being the case, Bitcoin’s future looks bright in a long-term perspective, but when analyzing its short-term outlook it appears that a pullback is likely to come. As it has been seen in the previous bull runs, BTC has had sharp corrections. These corrections keep the trend healthy and allow investors to take profits, providing new opportunities for others to enter longer-term positions.
As Thomas Lee, the co-founder of Fundstrat Global Advisors, pointed out “Bitcoin is a hyper-volatile asset” and minor correction will not affect the major trend.
reminder, Bitcoin is a hypervolatile asset.
This is great for volatility and other dedicated traders.
For most, taking a long-term view is more appropriate https://t.co/NX5FruWVEx— Thomas Lee (@fundstrat) June 27, 2019