 Bitcoin price may collapse below eight-year growth curve; can bulls retake control?
 Bitcoin price may collapse below eight-year growth curve; can bulls retake control?

Cover art/illustration via CryptoSlate. Image includes combined content which may include AI-generated content.
Once again, Bitcoin (BTC) has started to slip. After trading above the key $7,000 support for days on end, the cryptocurrency slipped on Monday, tumbling to $6,800, then $6,700 on Tuesday.
Right now, bears still seem to be in full control of the crypto market, having pushed BTC from $14,000 to $7,000 over the past six months.
With this latest drop, Bitcoin has come on the verge of breaking down from very key price levels—more information about these levels can be found in this CryptoSlate report.
In fact, a prominent analyst that called the move to the low-$3,000s in 2018 months in advance, recently noted that BTC is tapping a trend line that has been important for over eight years.
A breakdown of this level may imply an end of Bitcoin’s secular growth trend, which has brought the cryptocurrency from the doldrums of irrelevancy to one of the fastest-growing asset classes in a decade’s time.
Bitcoin may break eight-year growth channel
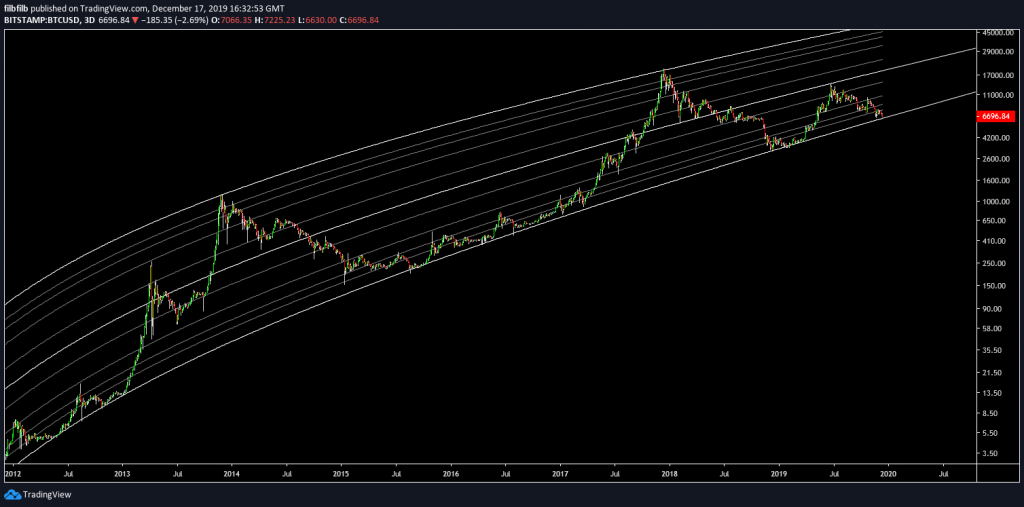
Filb Filb, one of the most recognized cryptocurrency traders, recently posted the chart seen below through his Telegram channel.
In the chart, you can see that the price of Bitcoin has been tracking a logarithmic growth channel for eight years, marked by consistently higher highs and lower highs on a macro basis.

The logarithmic growth curve that Filb Filb depicted is so perfect that the bottom bound of the channel was exactly where Bitcoin bottomed in 2018, failing to break below that level despite the calls for BTC to plunge to $2,000, or maybe even lower. To further add credence to the validity of this growth channel, Bitcoin found a swing top at $14,000, the exact middle of the channel, in June.
Why is this channel currently relevant?
Well, with Bitcoin’s recent decline to fall under $7,000, the price of the cryptocurrency has approached the bottom bound of the channel, which currently sits in the low-$6,000s.
Due to the curve’s historical importance to the cryptocurrency market, it is heavily implied that Bitcoin will need to hold this price level to maintain its ongoing secular bull market, which has made BTC the world’s best-performing asset over the past decade.
Can it hold?
This may leave readers asking the pressing question: can bulls hold the bottom of the logarithmic channel?
According to some analyses, for sure.
Adaptive Capital partner Willy Woo, for instance, noted that per his analysis of on-chain activity for Bitcoin, “the bottom is most likely in,” meaning that any move under the $6,500 level will only be a short-term wick, in his view. While another prominent analyst remarked that BTC holding above the key support in the low-$6,000s over the past few weeks strongly implies that a bottom is forming.
It is important to note that the prices marked by Filb Filb’s growth channel increase every day, meaning that BTC will need to form an uptrend from here on out to validate the long-term bull trends that will take the cryptocurrency market to new heights.
Bitcoin Market Data
At the time of press 6:48 am UTC on Dec. 18, 2019, Bitcoin is ranked #1 by market cap and the price is down 3.09% over the past 24 hours. Bitcoin has a market capitalization of $121.64 billion with a 24-hour trading volume of $24.69 billion. Learn more about Bitcoin ›
Crypto Market Summary
At the time of press 6:48 am UTC on Dec. 18, 2019, the total crypto market is valued at at $179.54 billion with a 24-hour volume of $85.4 billion. Bitcoin dominance is currently at 67.60%. Learn more about the crypto market ›


