Analyst that called Bitcoin’s drop to $3,000 in 2018 says the “bottom could be in”

Cover art/illustration via CryptoSlate. Image includes combined content which may include the use of AI tools.
On Nov 25., the price of Bitcoin fell off a proverbial cliff, tanking from $7,000 to $6,500 in a move that shocked traders the industry over. Since then, the cryptocurrency market has stabilized, with BTC, for instance, now finding itself nearly 15 percent higher than it was at the lows of that one fateful day.
While this recovery is not 100 percent indicative of a bottom, a number of analysts are coming to the conclusion that there's a good likelihood that Bitcoin's pain stopped when it plunged to $6,500 late last month.
One such analyst touting this sentiment is FilbFilb, a pseudonymous cryptocurrency trader that called the mean reversion move to the low-$3,000s in September of 2018, which was when BTC was flatlining in the low-$6,000s, a trend that analysts argued was bullish at the time.
Heres my updated doom senario for $btc.
The only change since Dec 4th '17 is the time it takes to get to the mean line, which has worked in the bulls favour.
I still think there is a reasonable argument to be had that the bottom is in.
fwiw im net short on trading positions. pic.twitter.com/S4HPqydvpt— fil₿fil₿ (@filbfilb) September 18, 2018
Has Bitcoin bottomed?
On Dec. 7, FilbFilb released the latest installment of his “Decentrader” newsletter. In it, he laid out a confluence of signs on Bitcoin's chart, procured through the use of technical analysis, that implies that the cryptocurrency's price outlook is starting to lean in the favor of bulls, or at least that BTC bottomed at $6,500.
Firstly, the analyst looked to the fact that Bitcoin bounced off the “miner's bottom,” the price at which the average cryptocurrency breaks even when mining BTC. This is notable as the crypto market bottomed when Bitcoin interacted with the miner's bottom in December 2018. That's not to mention that the price chart printed an area of so-called bullish divergences at the $6,500 level.
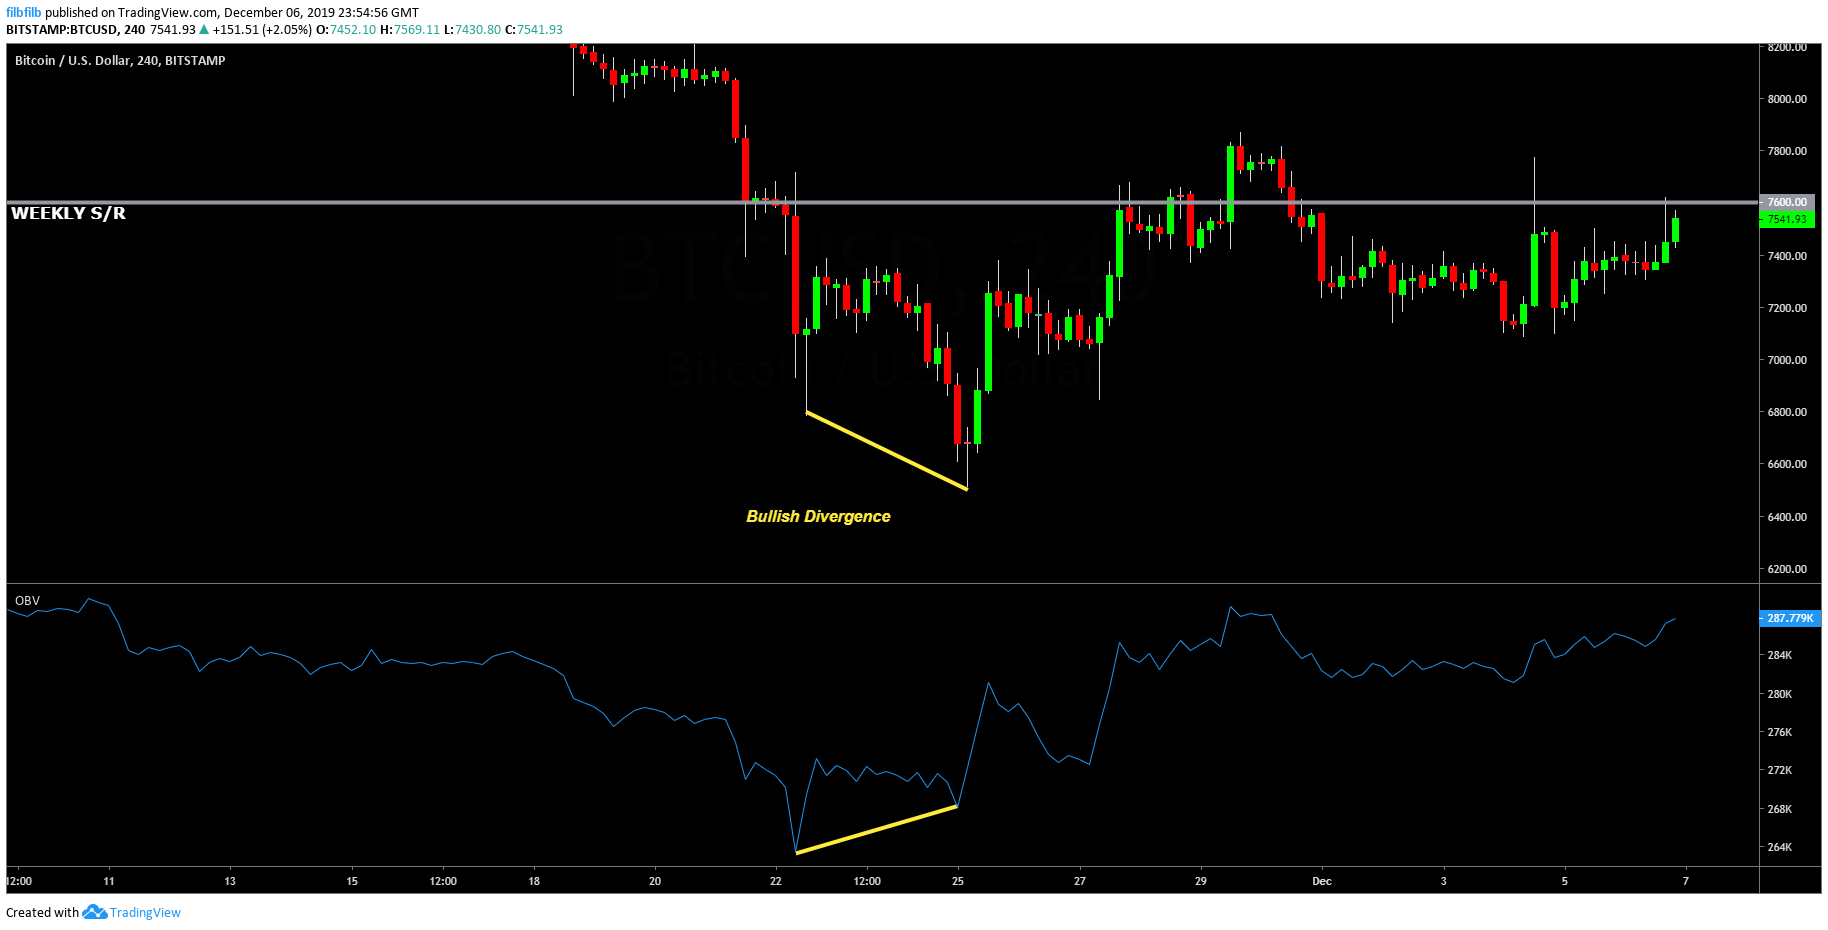
Also, a “bullish (golden) cross” is about to be formed by the 50-week and 100-week simple moving averages, while volume and price have declined in tandem, “hinting at bullish reversal.”
Sentiment corroborated
It isn't only FilbFilb that has observed signs that Bitcoin is in the midst of bottoming on a macro scale.
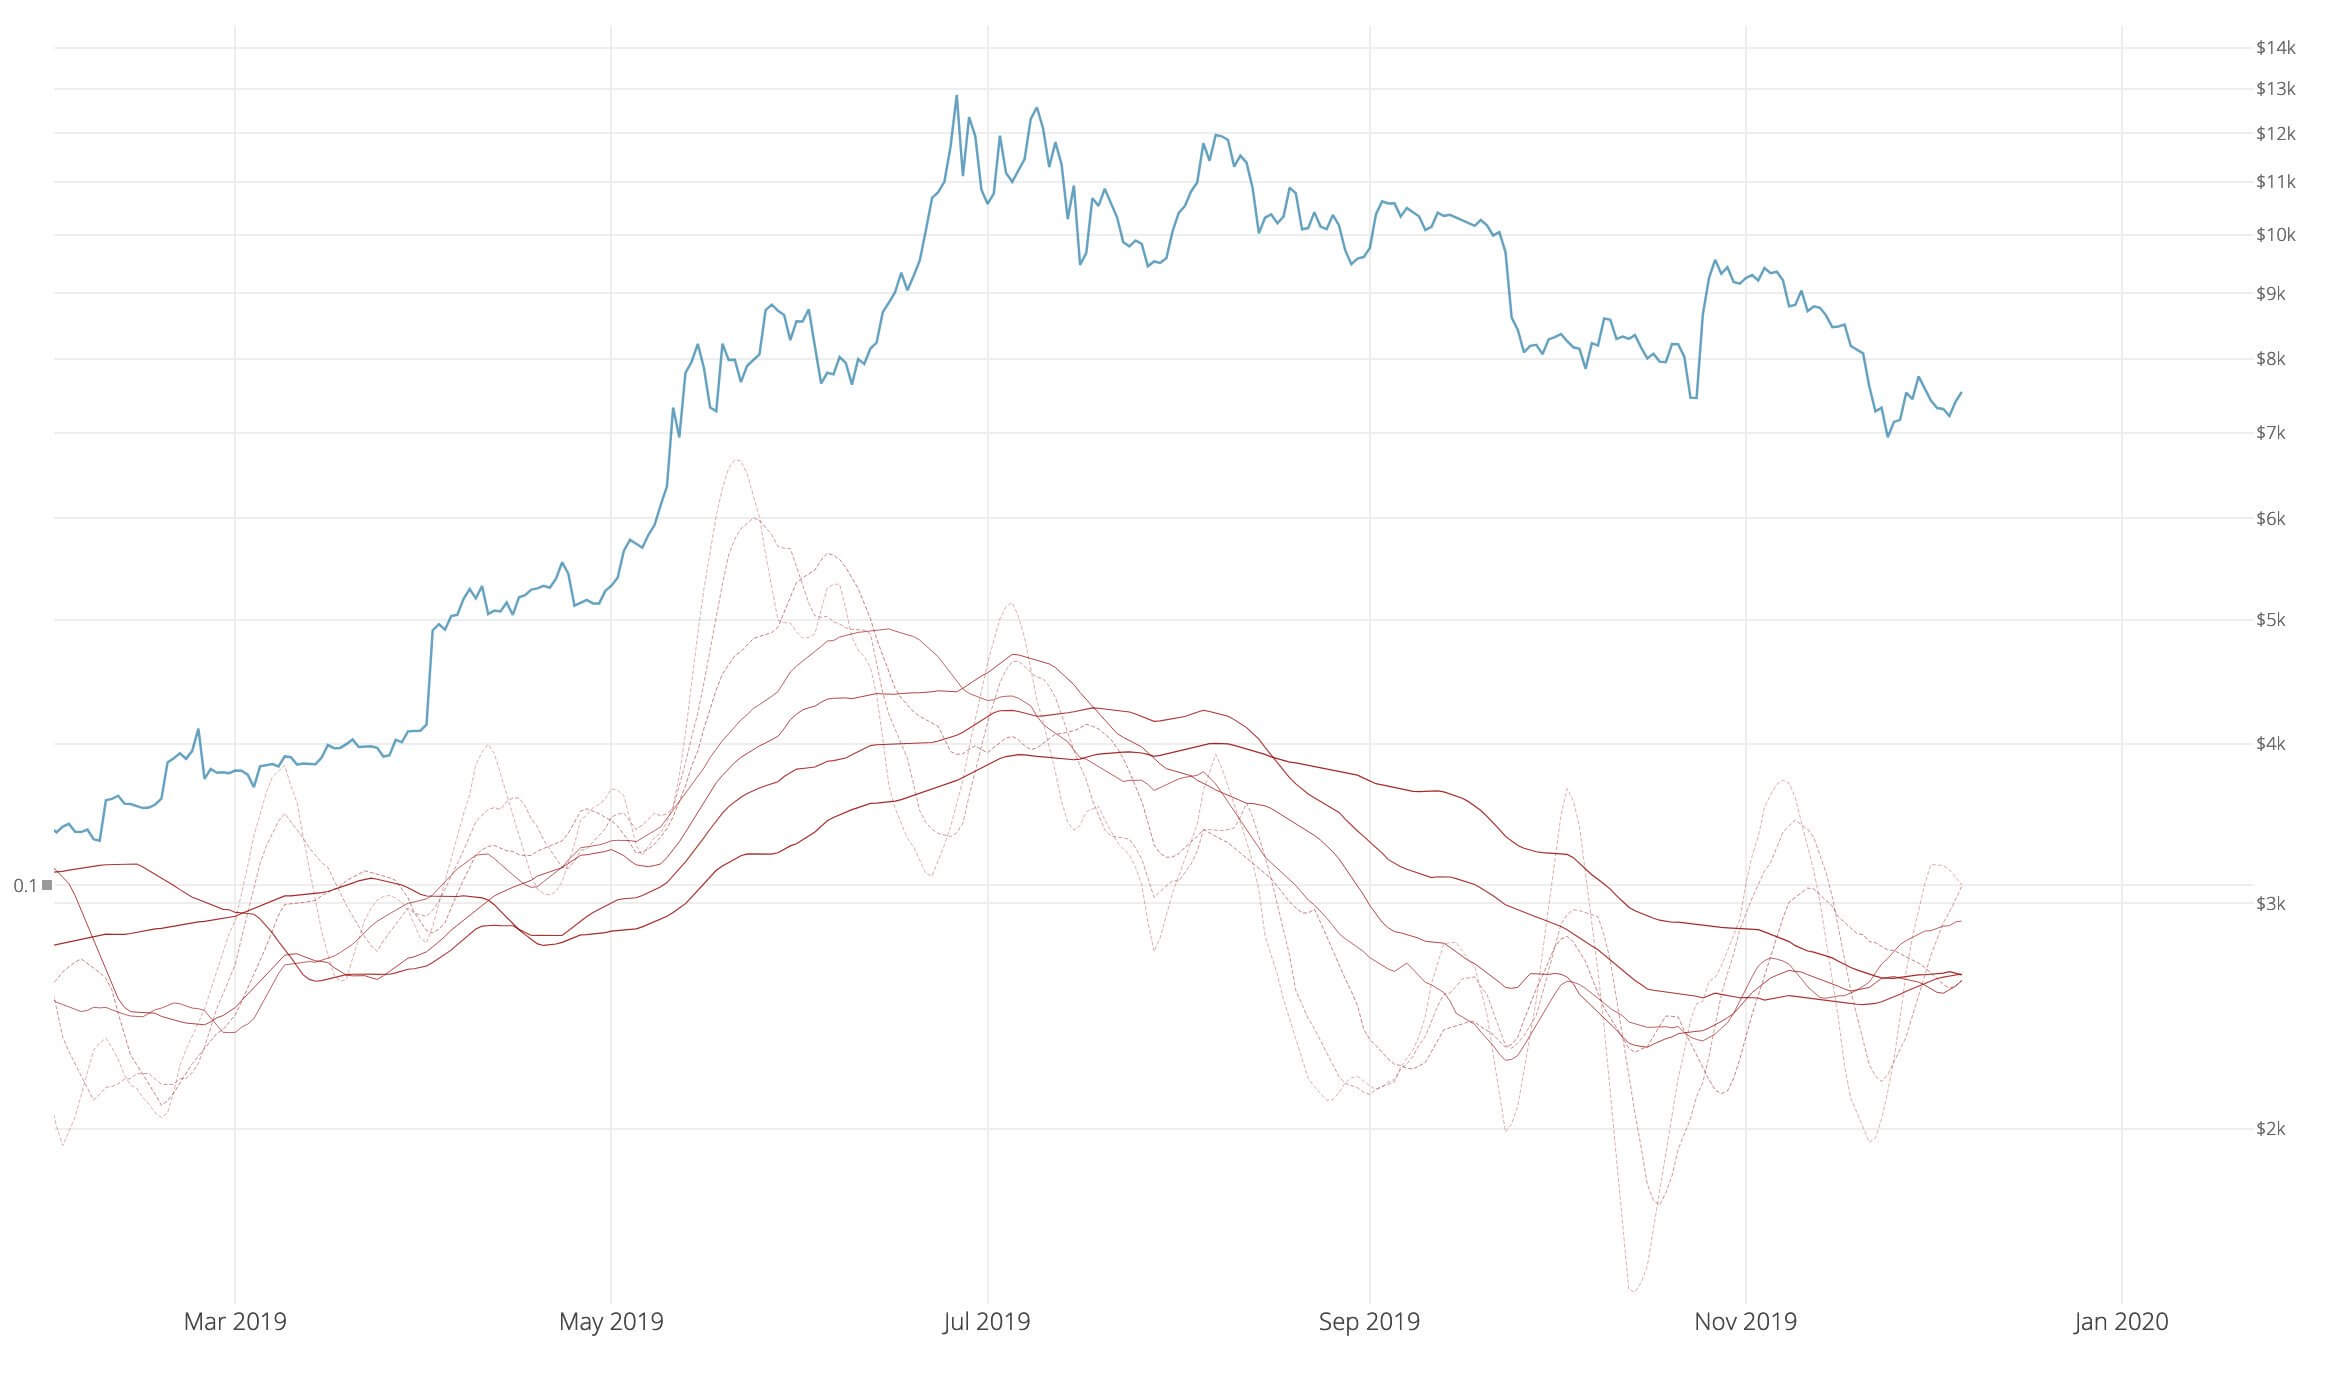
Adaptive Capital's Willy Woo, a popular on-chain metrics analyst, noted on Dec. 7 that a proprietary indicator his fund uses is implying that the usage of the Bitcoin network is implying that bulls will soon gain the upper hand again:
“On-chain momentum is crossing into bullish [territory]… The bottom is most likely in, any [move] lower will be just a wick in the macro view.”
Another market analyst has corroborated this, recently posting the chart that can be seen below. In it, he depicts that Bitcoin's long-term $6,300 Point of Control (POC) — a price at which an asset saw the most trading activity—was front-run by investors during the drop to $6,500.
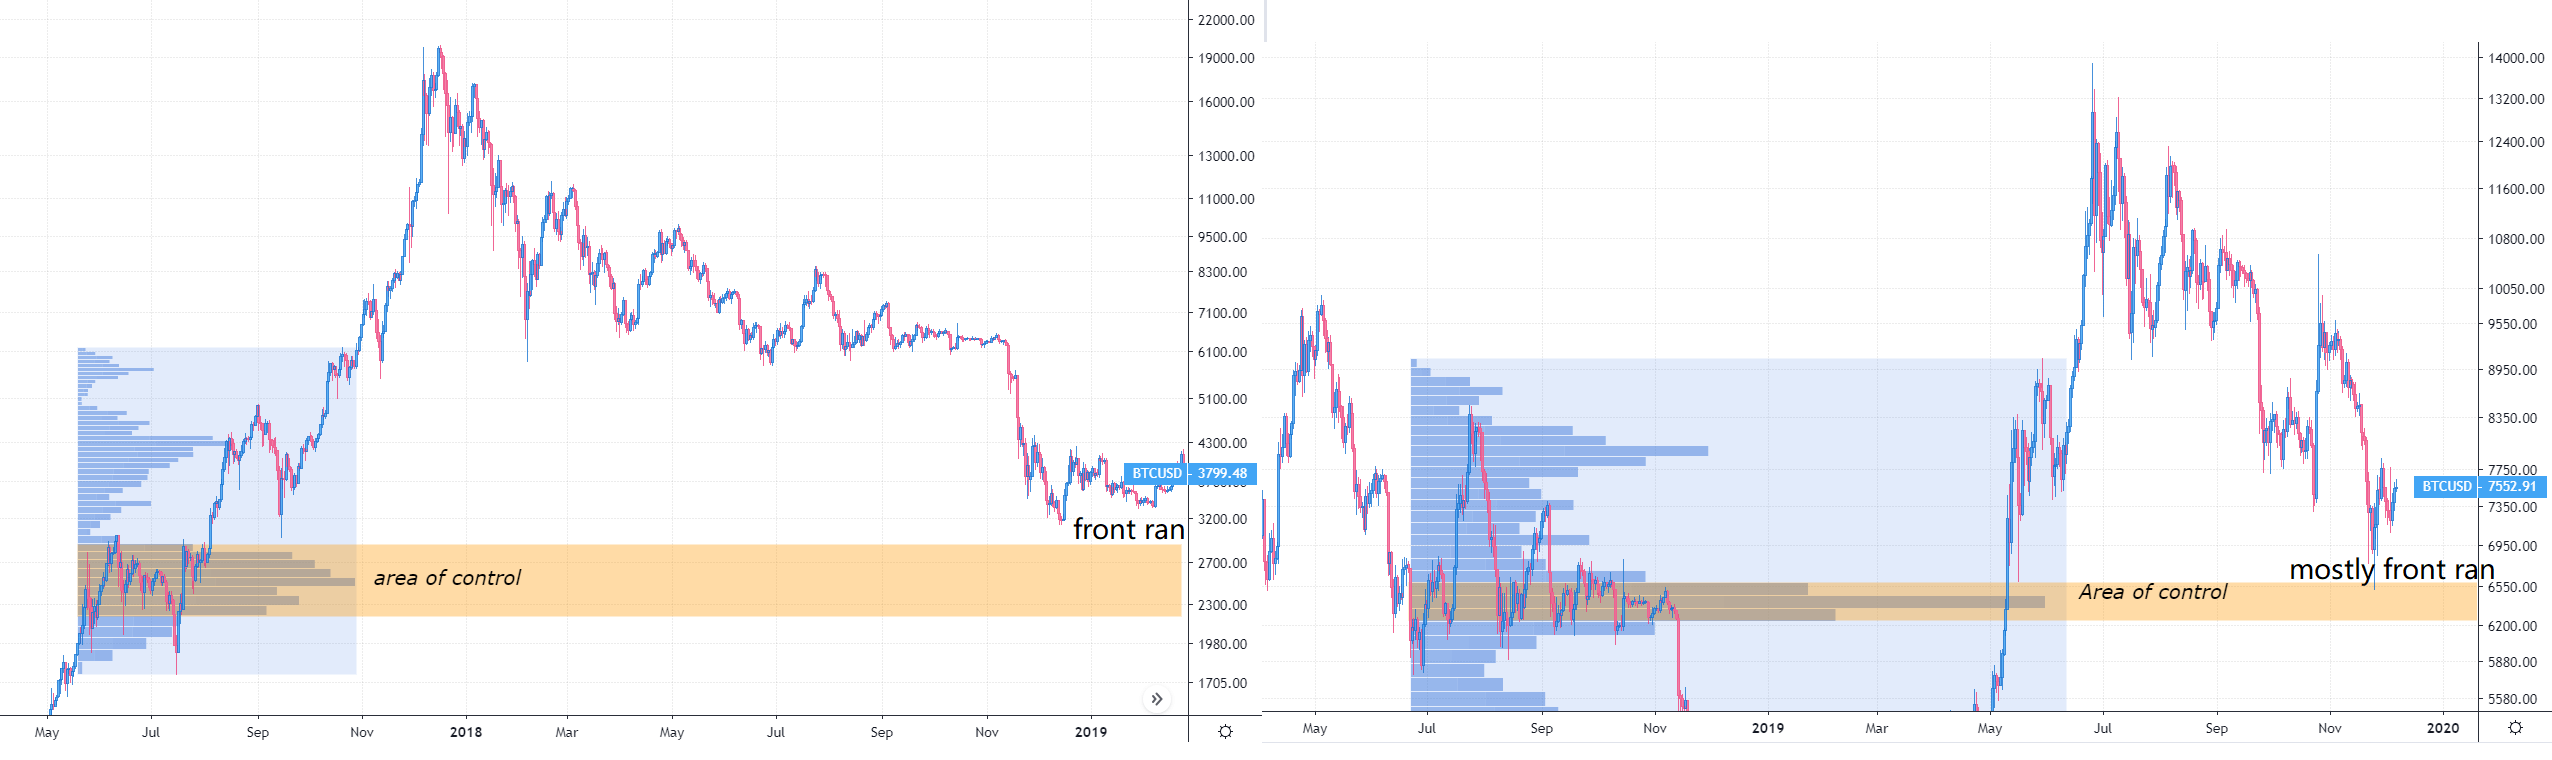
While there is no guarantee that cryptocurrency bears will push the cryptocurrency to actually test the POC in and around $6,300, which is now 15 percent lower than Bitcoin's current price, a similar pattern of “front running” the POC was seen during the $3,100 bottom of December 2018.
Thus, if historical price action is of any current relevance, Bitcoin is likely to continue rebounding from here.