Is Bitcoin bottoming out like it did a year ago?

Cover art/illustration via CryptoSlate. Image includes combined content which may include the use of AI tools.
As Bitcoin approaches the $6,500 support level, some of the most prominent analysts in the industry believe that a market bottom could be near just like it happened over a year ago.
History tends to repeat itself
After reaching an all-time high of $19,890 on Dec. 17, 2017, Bitcoin went through a steep bear market. The flagship cryptocurrency saw its price plummet over 80 percent throughout 2018. But, on Dec. 15 of that year, BTC hit a low of $3,215, which marked the bottom of the bear market.
Following the end of the downward trend, the pioneer cryptocurrency skyrocketed almost 330 percent. Bitcoin surged to reach a high of nearly $14,000 on June 26. Since then, this crypto entered a corrective phase that has pushed its price down over 50 percent. And, it is now hovering around $6,700.
Under the concept of seasonal cycles, it seems like December poses a lot of significance to Bitcoin’s trend. As explained above, in Dec. 2017 this cryptocurrency hit a new all-time high and in Dec. 2018 it hit a market bottom. If seasonality is indeed a key factor of BTC’s market cycles, is history about to repeat itself?
Signs of a market bottom
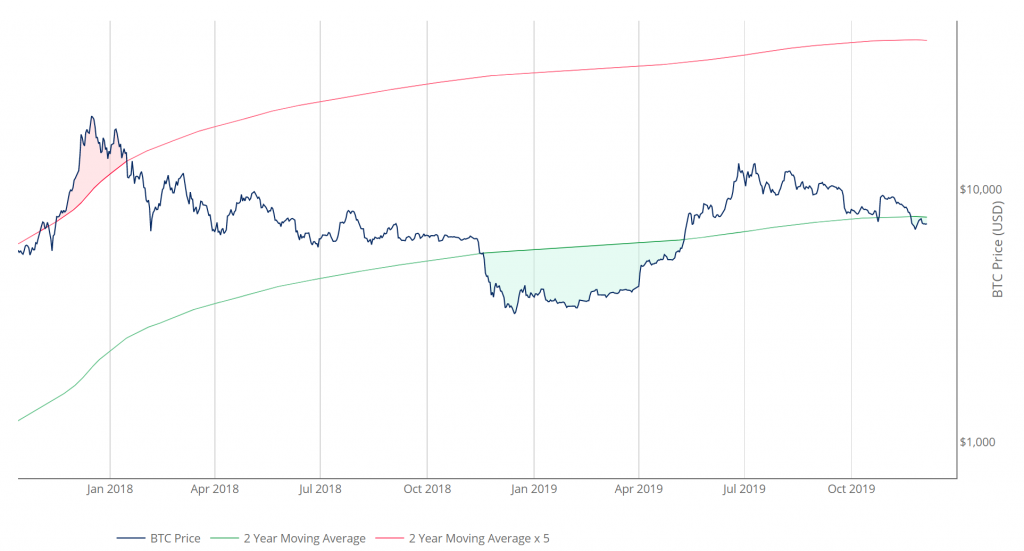
Based on the 2-year moving average (MA) multiplier indicator, Sawcruhteez, a financial analyst and swing trader, believes that Bitcoin entered an “accumulation” phase as it moved below the 2-year MA. This resembles the accumulation zone that BTC went through in 2018 after plunging below $5,600.
Swift, the creator of the 2-year MA multiplier indicator, maintains that:
“Buying Bitcoin when the price drops below the 2-year MA has historically generated outsized returns.”
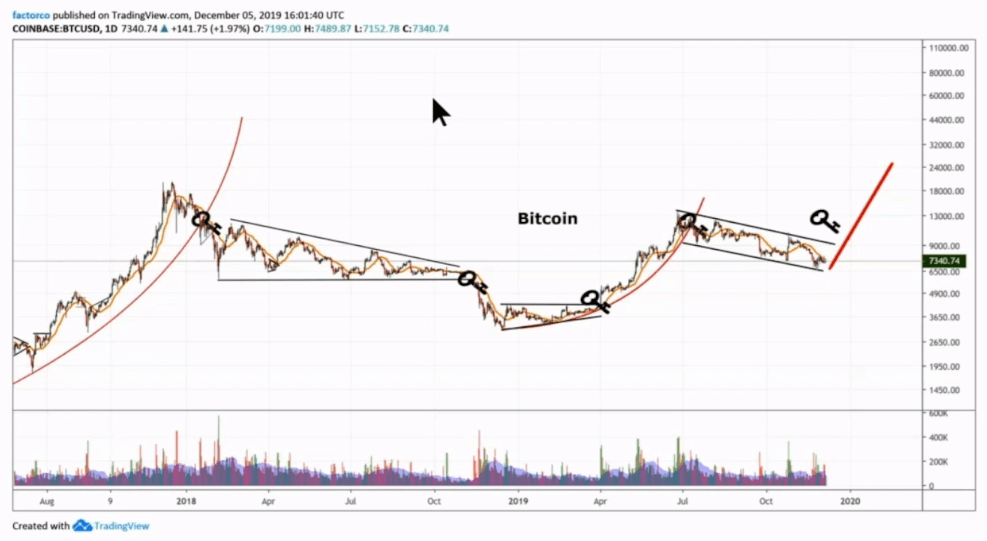
Along the same lines, Peter Brandt, a 45-years trading veteran, stated that Bitcoin’s price action has been contained within a descending parallel channel after the peak at nearly $14,000 on June 26.
Since then, every time the pioneer cryptocurrency hits the bottom of the channel, it bounces off to the middle or the top. But, when it hits the top of the channel, it falls back to the middle or the bottom.
As Bitcoin moves closer to the lower boundary of the multi-month descending parallel channel, Brandt argues that a bottom is “imminent.” BTC would likely rebound from this area and break out of the channel in an upward direction.
Such a bullish impulse would trigger a new parabolic phase taking Bitcoin to “attack” the all-time high of 2017 and “slice” decisively through it, according to Brandt.
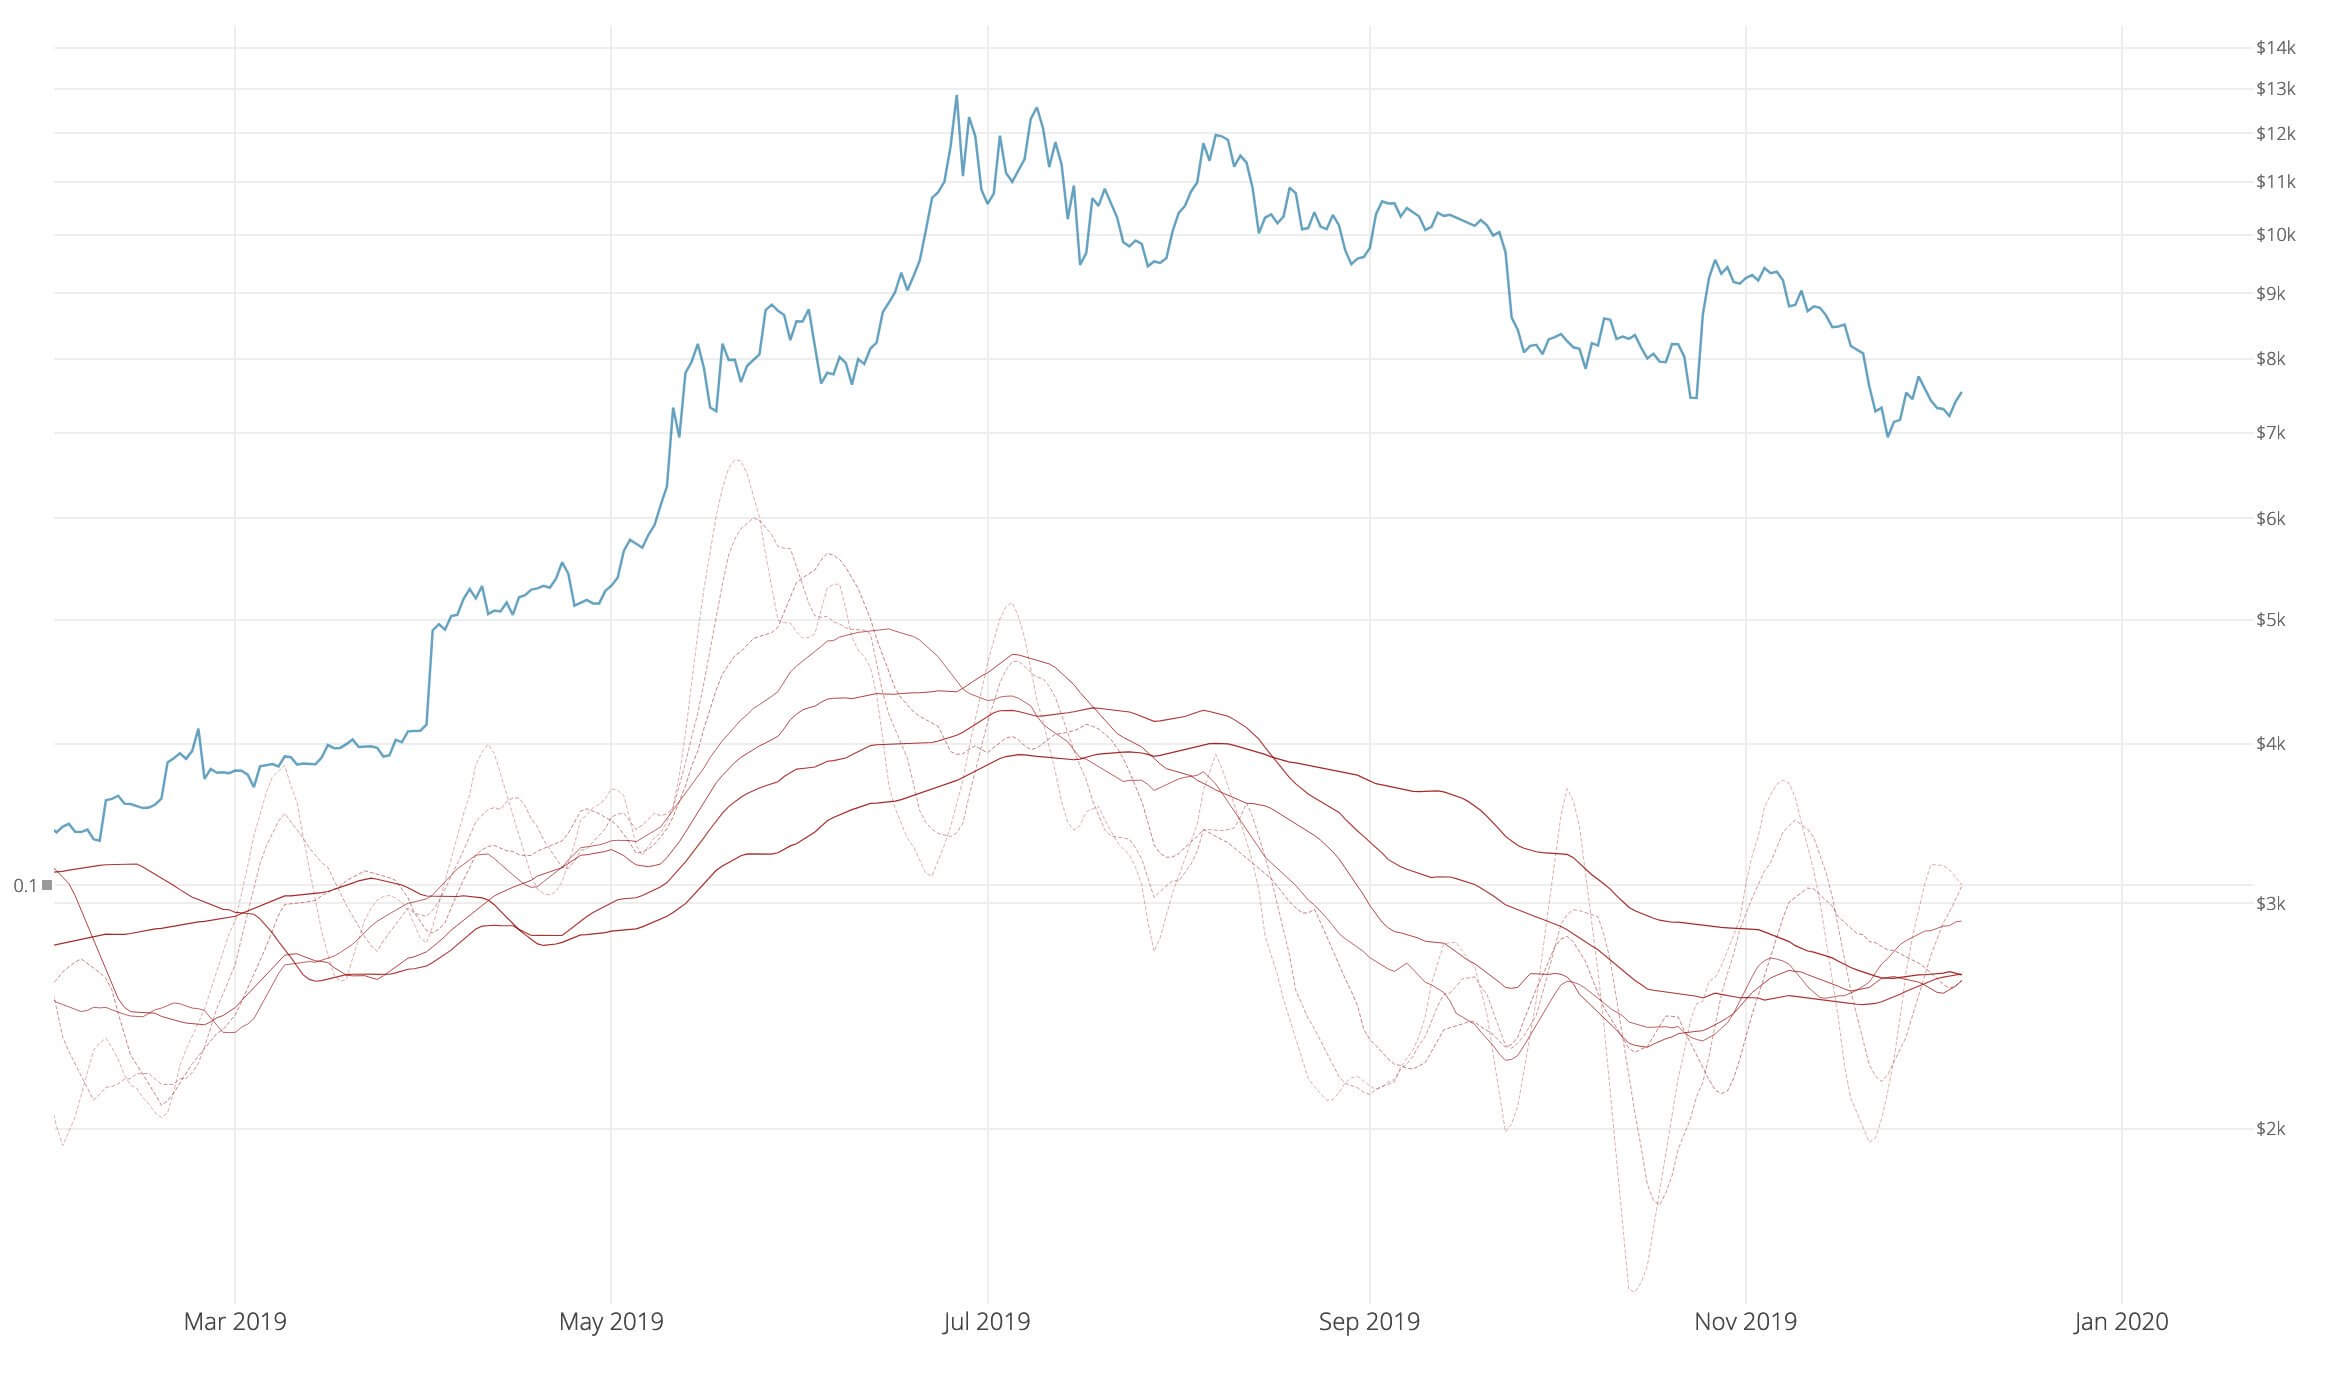
Moreover, Willy Woo, a popular on-chain metrics analyst, noted on Dec. 7 that based on the usage of the Bitcoin network, bulls will likely gain the upper hand once again.
Woo affirmed:
“On-chain momentum is crossing into bullish [territory]… The bottom is most likely in, any [move] lower will be just a wick in the macro view.”
Moving forward
Despite the bullish outlook presented by these technical analysts, there are multiple bearish signs that suggest that Bitcoin could aim for lower lows. If history indeed repeats itself and BTC behaves as it did in December 2018, then the 150-week moving average would likely break.

Closing below this support level that sits around $6,500 would trigger a further decline. The next level of support is given by the 200-week moving average that is hovering around $5,000.
During his latest podcast, Tone Vays, a former VP at JP Morgan Chase, said that he was “pretty damn confident” that BTC is going to go below $6,500. Now, it remains to be seen if such a bearish move would be met with high demand allowing Bitcoin to finally bottom.