 Data shows how Aave overtook Compound in DeFi lending
 Data shows how Aave overtook Compound in DeFi lending
Despite its platform being launched in just 2020, Aave (AAVE) outgrew its established competitor Compound (COMP) and multiplied its market cap eightfold within half a year.

Photo by Braden Collum on Unsplash
In an industry with plenty of fast ascents and precipitous falls, many wondered whether the platform had the staying power to remain a central institution in DeFi lending.
Nearly 2 years later, Aave is still going strong, especially in relation to its one-time close rival.
This article will take a closer look at the two platform’s strengths and weaknesses and explain why Aave was able to overtake Compound.
Aave and Compound TVL Compared

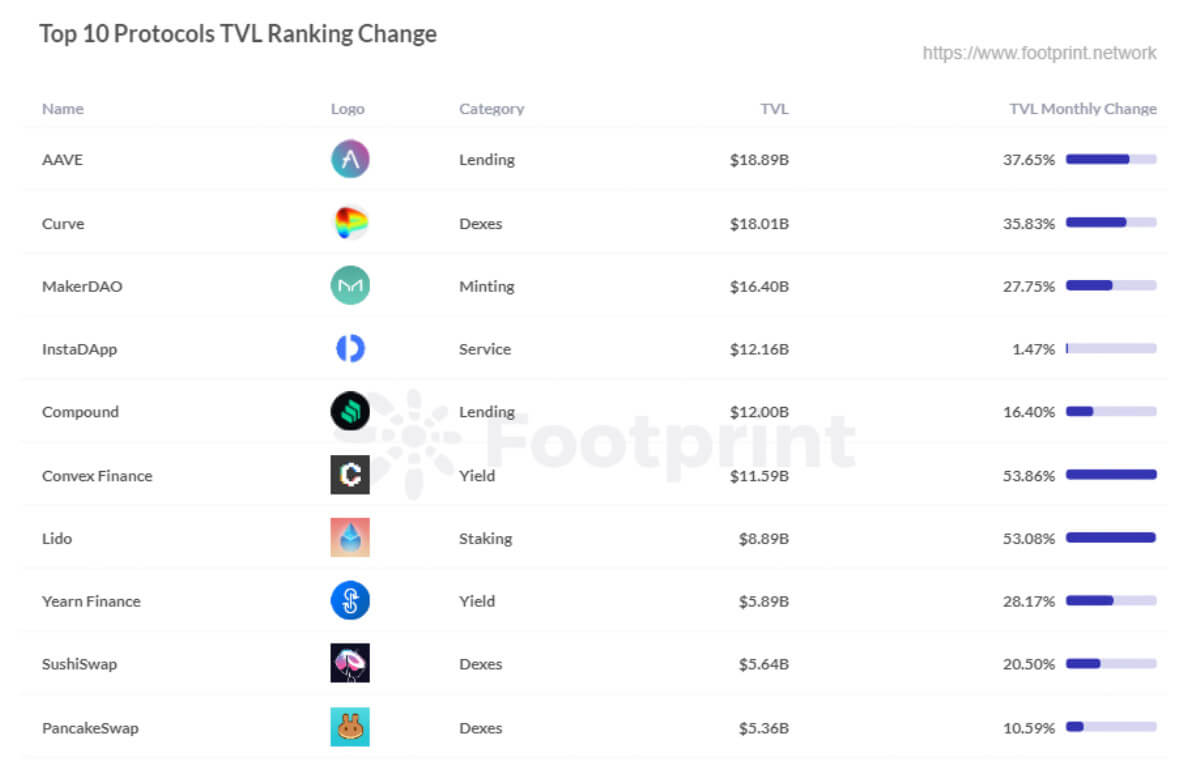
As of Oct. 20, the DeFi market has surpassed $200 billion in total locked-in value (TVL) at $241.575 billion, with Aave’s TVL gaining the largest share at $18.89 billion. This is followed by lending protocols Curve ($18.01 billion), MakerDAO ($16.4 billion) and Compound ($12 billion).

In the lending space, Aave’s TVL has been way ahead of Compound in the last six months. This can be attributed to its model, which is similar to traditional finance, and its ability to operate in Financial Conduct Authority-encrypted assets.
Comparison of Market Cap
As of Oct. 20, Aave continues to dwarf Compound in the DeFi lending and borrowing industry with a market cap of over US$4 billion versus the latter’s $1.97 billion.
There are two other metrics that indicate Aave’s strong position in the future.

First, its circulating supply of 82% is higher than Compound’s 61%, indicating less inflationary pressure.
Second, Aave has not had any major security incidents, indicating better security mechanisms likely favored by depositors.
Aave’s deposit volumes dominate
Aave’s deposit volume of approximately $21 billion has remained higher than Compound’s estimated $18 billion. Compound previously went live with subsidized lending and mining (disguisedly raised deposit returns and lowered lending rates to compete with Aave). Today, Aave has turned to lending and mining, coupled with Polygon’s deposit and lending subsidies. Compound’s rate advantage has largely disappeared as a side-effect of Aave’s ecosystem bargaining power.

The Aave team continues to focus on innovation while being highly risk-aware, and adjusts the direction of the product in a timely manner when issues arise, making the platform more secure.
Can Aave users lend out more assets than Compound?
Data for the previous month shows that Aave’s borrowing balance has leveled off above $8.2 billion per day, which is still higher than Compound’s borrowing balance of $5-7 billion, with little overall volatility.

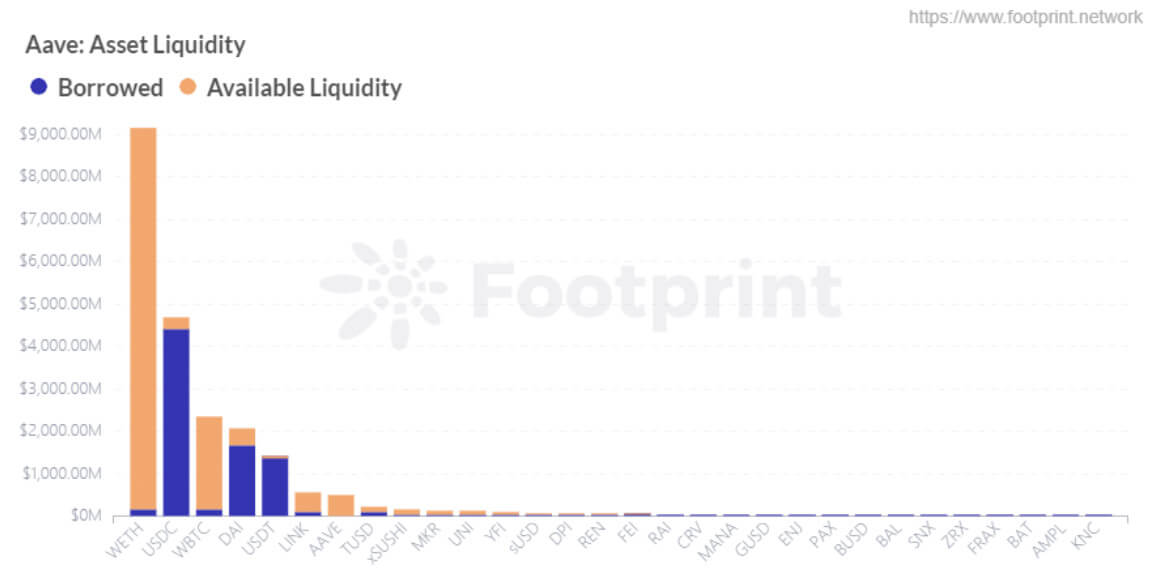
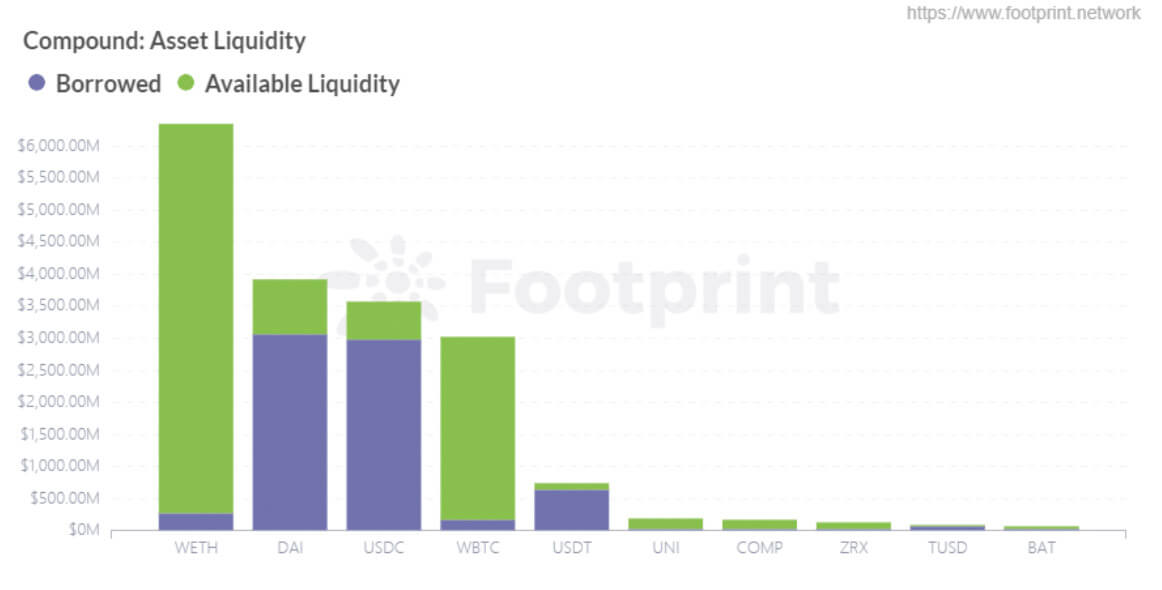
Aave supports a wider variety of tokens, allowing users to lend out more assets and have more liquidity available. Some of Aave’s rate agreements are also considered more innovative and have some advantages over Compound, such as unsecured flash loans, rate swaps and line of credit mandates. But on the downside, it comes with relatively high lending rates and loan fees.


Aave and Compound support a variety of cryptocurrencies, including stablecoins such as DAI, USDC and USDT, and non-stablecoins such as WBTC and UNI. With Aave, users mainly pledge ETH to lend USDC, DAI and USDT. With Compound, users pledge ETH to lend DAI and USDC. While the supply of DAI and USDC is about the same, the former has more demand than the latter.
It is also worth noting that Aave is one of the few licensed projects and is freely convertible in the United Kingdom.
Differences in liquidation
There are currently two traditional liquidation methods: the auction format of MakerDao and the liquidation method of Aave and Compound, which operate on a first-come, first-served basis.
Compound sets a liquidation line of 75% as well as a borrowing rate that triggers liquidation when 100% is reached. However, only 50% of its assets will be liquidated.
Aave, on the other hand, has a 5% safety cushion, mitigates risk, especially for new users.
Conclusion
In summary, Aave continues its dominance over Compound, mainly due to the following points:
- Aave has been more aggressive in innovation and business expansion, having more types of tokens released on its platform and gaining relative traction on unsecured flash lending, automated market makers, line of credit mandates, and with the traditional finance industry.
- On 19 October 2021, Aave TVL hit an all-time high that was made possible by the team behind the company whose focus is on safety, risk management and product strategy.
- Aave has progressed much faster in terms of compliance to mitigate risk.
The above content is only a personal view, for reference and information only, and does not constitute investment advice. If there are obvious errors in understanding or data, feedback is welcome.
This post was brought to you by Footprint Analytics.
What is Footprint Analytics?
Footprint Analytics is an all-in-one analysis platform to visualize blockchain data and discover insights. It cleans and integrates on-chain data so users of any experience level can quickly start researching tokens, projects, and protocols. With over a thousand dashboard templates plus a drag-and-drop interface, anyone can build their own customized charts in minutes. Uncover blockchain data and invest smarter with Footprint.


