 Data shows bitcoin most overbought since 2017: parabolic phase or impending crash?
 Data shows bitcoin most overbought since 2017: parabolic phase or impending crash?

Photo by Bill Jelen on Unsplash
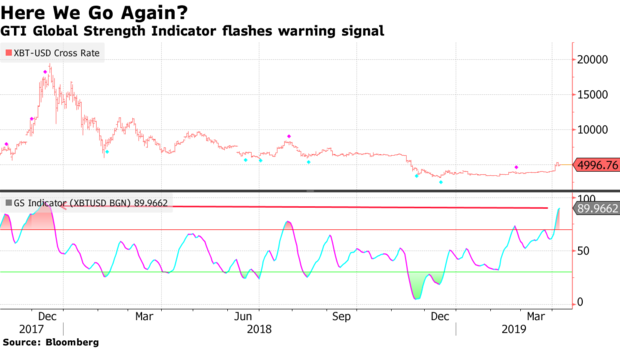
Bitcoin is currently at its most expensive levels in 2019. According to the GTI Global Strength Indicator—a technical analysis tool that gauges intraday crypto volatility, bitcoin is currently in ‘overbought’ territory—suggesting it could be entering a “parabolic phase,” or be prepared for another downturn.
GTI Global Strength Indicator Warns About Bitcoin’s Massive Rally
After a year of crypto winter, it seems that the market is finally thawing. While many have expected a spring rise in cryptocurrency prices, few could have predicted such fast-paced growth since the beginning of 2019.
However, the rapid rise might not be good news. According to the most recent data from the GTI Global Strength Indicator, the rise could indicate impending retracement, or worse.

Bitcoin is currently at its most expensive levels since just before the cryptocurrency crash of 2018, after it broke above $5,000 for the first time in November of last year. The GTI Global Strength Indicator showed that the coin was the most overbought during its run-up to nearly $20,000 in December 2017.
The world’s largest cryptocurrency climbed another 3 percent on Friday, mimicking the patterns that have in the past preceded multi-week downturns. Mike McGlone, a Bloomberg Intelligence analyst, explained that the low volatility compressed the market, making a downturn a matter of time:
“Now it’s a question of duration and I suspect when you have such a massive bubble, you’ll always have an overhang of people who need to sell,” he said.
What Does this Bull Run Mean for Bitcoin?
While the surge in bitcoin’s price might spell profit for traders and short-term investors, many experts have questioned whether or not the gains are salient. An overbought position often correlates to price drops as the market gets more and more saturated.

The last time bitcoin was overbought this much, it plummeted down from its all-time high of $20,000 in December 2017 to around $6,000 in February 2018.
David Tawil of ProChain Capital said that Bitcoin’s price surge isn’t a particularly comforting development. He expects this rally will be followed by another downward leg.
Meanwhile, Peter Brandt, an author and well-known commodity trader, speculates bitcoin could be entering another “parabolic phase.” This means that the world’s largest coin could be set for another massive bull run, possibly even larger than the one that happened in 2017, as suggested by Brandt.
Either from Dec '18 low or from retest of same (circa analog dbl bottom in 2015) it would not surprise me if $BTC enters a new parabolic phase. $btcusd pic.twitter.com/XV89Qz7P4n
— Peter Brandt (@PeterLBrandt) April 5, 2019
And while many other prominent figures in the crypto industry have voiced their opinions on the current market situation, there doesn’t seem to be a consensus among them. Some are saying that bitcoin is yet to bottom out, predicting a drop below $2,000, while others believe that BTC breaking above its $6,000 “psychological barrier” is slated to happen soon.
Bitcoin Market Data
At the time of press 2:53 am UTC on Nov. 7, 2019, Bitcoin is ranked #1 by market cap and the price is up 3.49% over the past 24 hours. Bitcoin has a market capitalization of $91.34 billion with a 24-hour trading volume of $17.55 billion. Learn more about Bitcoin ›
Crypto Market Summary
At the time of press 2:53 am UTC on Nov. 7, 2019, the total crypto market is valued at at $180.49 billion with a 24-hour volume of $60.95 billion. Bitcoin dominance is currently at 50.53%. Learn more about the crypto market ›


