 Data metrics surrounding Bitcoin’s miner dynamics all point to a long-term bottom
 Data metrics surrounding Bitcoin’s miner dynamics all point to a long-term bottom

Cover art/illustration via CryptoSlate. Image includes combined content which may include AI-generated content.
Ever since Bitcoin’s capitulatory drop to lows of $3,800 seen in mid-March, investors and analysts alike have all been attentively watching for signs that these lows will ultimately mark a long-term bottom.
The benchmark cryptocurrency’s strong rebound from these lows has certainly been a positive sign that bolsters the theory that BTC won’t dip below this level again, but analysts are still offering conflicting opinions on whether or not it currently has technical strength.
It now appears, however, that data surrounding Bitcoin’s miner dynamics does seem to suggest that there won’t be any lower lows, and that further upside may be imminent as miner-based selling pressure alleviates.
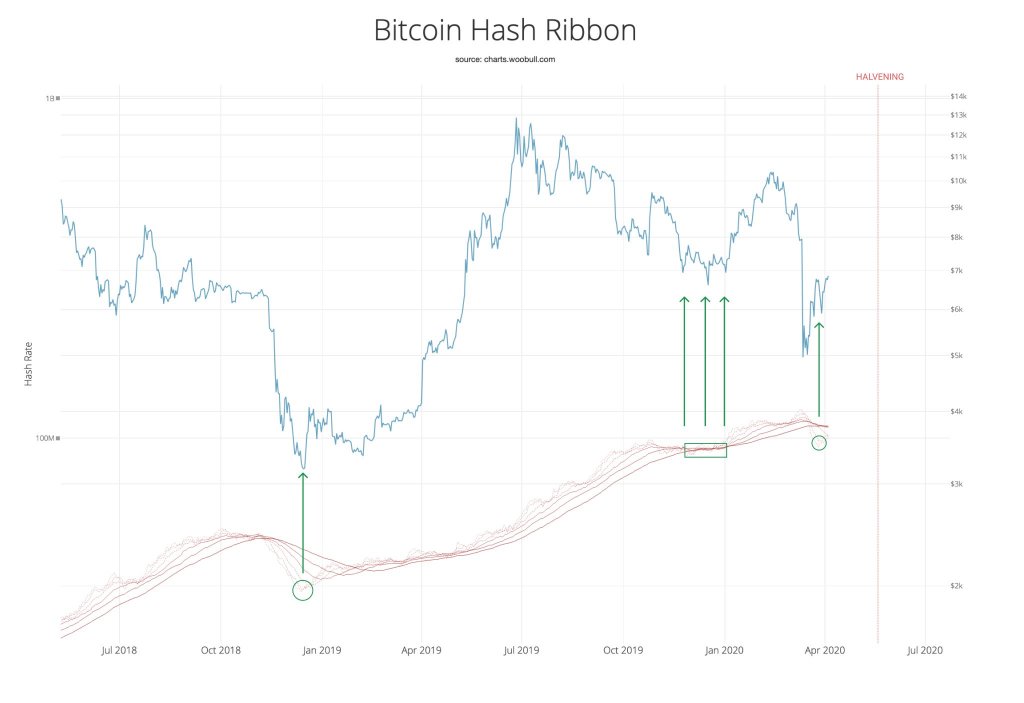
Bitcoin mining “hash ribbons” tell a bullish tale
The dynamics seen amongst Bitcoin miners can offer investors with significant insights into the cryptocurrency’s underlying market structure.
One particular metric that can be used to determine the impact that miner-based selling pressure is having on the cryptocurrency is by looking at its hash-ribbons – or sometimes referred to as “difficulty ribbons.”
This indicator is comprised of moving averages of Bitcoin’s network difficulty, being bullish when the ribbons compress and bearish when they widen.
Willy Woo – a prominent analyst who focuses on on-chain data – spoke about Bitcoin’s hash ribbons in a recent tweet, explaining that they are currently flashing a reliable bottom sign, suggesting that the recent selloff led to significant capitulation amongst miners. He said:
“A tale of 2 miner charts. Bullish. Hash Ribbons recovering (assumes no lower low), a reliable bottom signal, probably some miner capitulation during the crash. They last got culled in Dec 2018, only the strong remain, I don’t expect miners to add more sell pressure from here.”

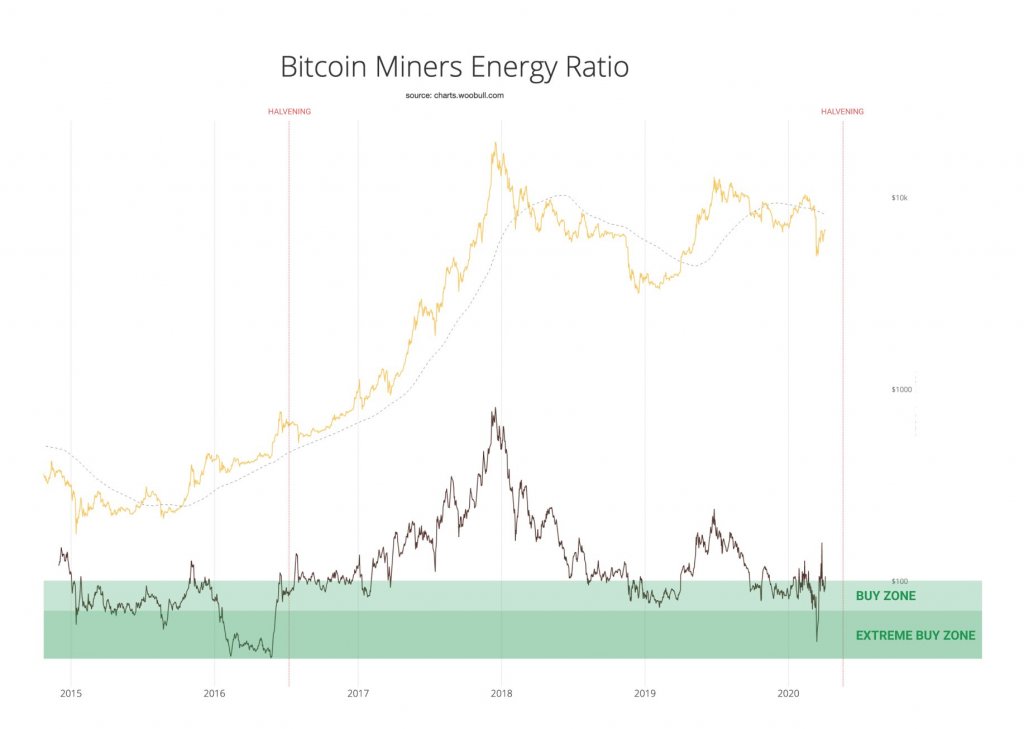
BTC miner energy ratio also flashing buy signs
Compressing hash ribbons aren’t the only things currently counting in Bitcoin’s favor, as Woo also notes that miner’s energy ratio is in the buy zone.

This ratio is determined by comparing the crypto’s market cap to its energy consumption, which shows that the profit margin for mining BTC is at historic lows – a phenomenon that often is a reliable bottom sign.
“Miners Energy Ratio, the ratio between Bitcoin’s marketcap to its energy consumption is in the buy zone. (Energy data from CBECI). Profit margin for minting new coins are at historic lows, a good sign for bottoms.”

This also comes just over one month before Bitcoin’s halving event, which may lead to another bout of capitulation amongst miners, flushing out the weaker ones while also reducing the crypto’s inflation rate by over 50%.


