As major selling pressure for Bitcoin is absorbed, does it mean a relief rally is near?

Cover art/illustration via CryptoSlate. Image includes combined content which may include the use of AI tools.
According to analysts, selling pressure across major spot exchanges like Coinbase and Binance is getting absorbed. Technical analysts have become increasingly optimistic as Bitcoin may be showing a bottom.
Well-known Bitcoin trader Jacob Canfield said that “lots of sells” are being bought up on low time frames, indicating that a relief rally in the short-term may be likely.
Bottom-like structure for Bitcoin
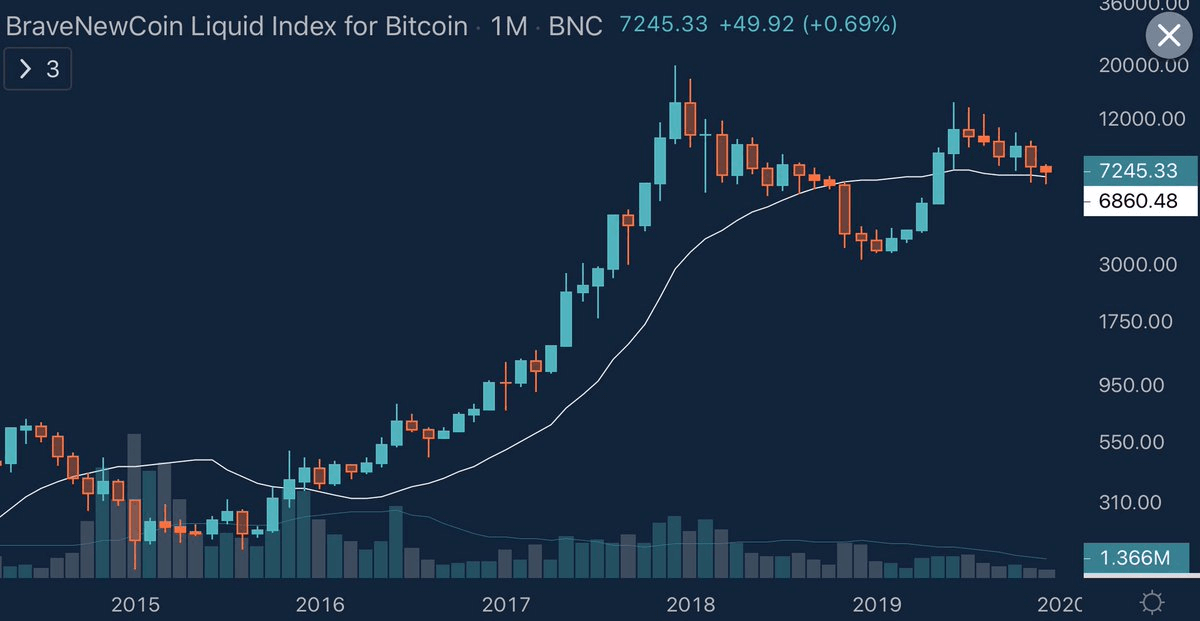
According to analysts at Ledger Status, the monthly BTC chart of bitcoin with the 20 simple moving average (SMA) indicator is currently demonstrating signs of a bottom.
As technical indicators point towards a short-term accumulation period, Tether (USDT) is also showing premiums against Bitcoin. Typically, when the USDT/BTC pair is being traded at a higher price than fiat exchanges, it indicates that investors are accumulating.
Three Arrows Capital CEO Su Zhu said:
“BTC/USDT premiums and price action show clear signs of accumulation and money flow back into risk. Would not surprise me to see 9K+ before end of Jan.”
Analysts are anticipating a relief rally in the imminent future because the signals of a short-term bottom also coincide with the monthly close of bitcoin.
In three days, the monthly candle of bitcoin will close, which is likely going to be the seventh lower high candle since early 2019. While Bitcoin is technically on a bearish trend, a relief rally is likely to occur as BTC looks toward a critical juncture on December 31.
Where are analysts looking at?
DonAlt, a cryptocurrency technical analyst, suggested that bitcoin could retest the high point of the current range between $6,700 and $7,900. He said:
“Still on track, still looks like we'll visit range high. Long squeeze into short squeeze has been the name of the game in the 2nd half of 2019, no reason to expect that to change.”
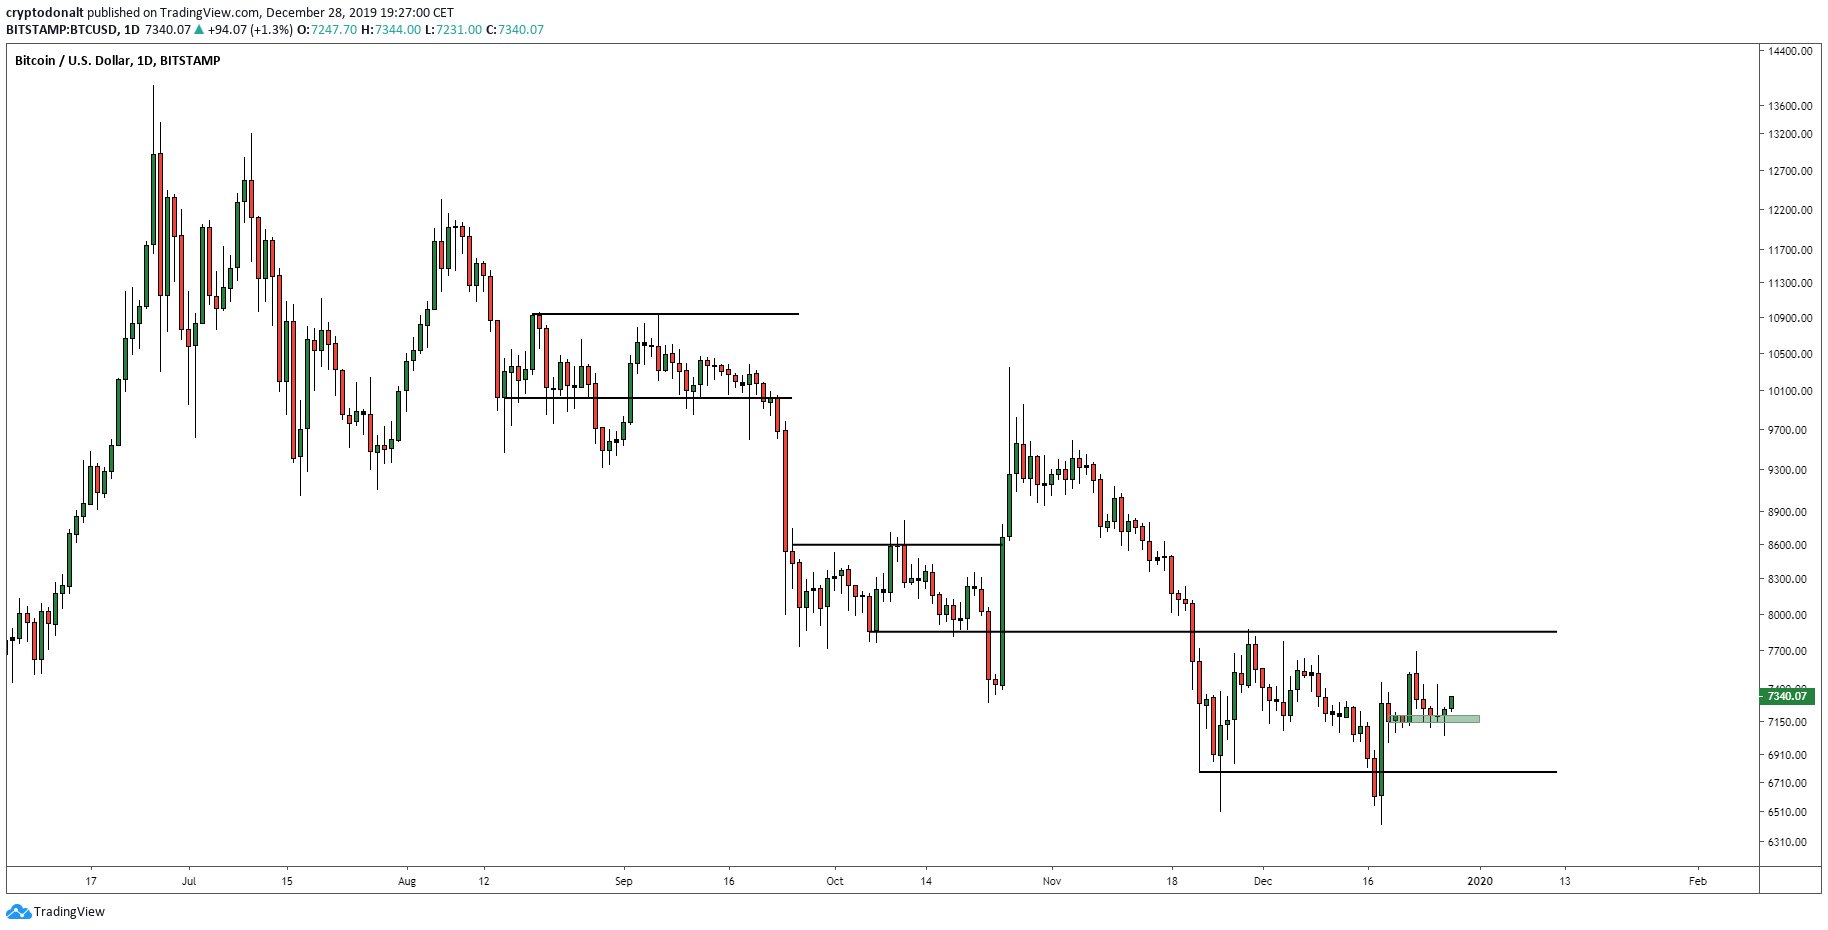
But, traders are not considering the next relief rally to go much further above the range, as the $7,900 level has been proven to be a heavy resistance level since late November.
It is still too early to determine whether the macro trend of Bitcoin is optimistic as BTC and the rest of the cryptocurrency market have not shown strong signs of a complete reversal. Technical analysts are predicting a brief relief rally to occur solely because of the absorption of selling pressure on low time frames and the imminent monthly close of BTC.
There are no major catalysts for Bitcoin until the block reward halving in May 2020 and even then, historically, halvings have not had a large impact on the bitcoin price until 6 to 12 months after.