 Correlation between Bitcoin and S&P 500 hits a 10-month low
 Correlation between Bitcoin and S&P 500 hits a 10-month low

Cover art/illustration via CryptoSlate. Image includes combined content which may include AI-generated content.
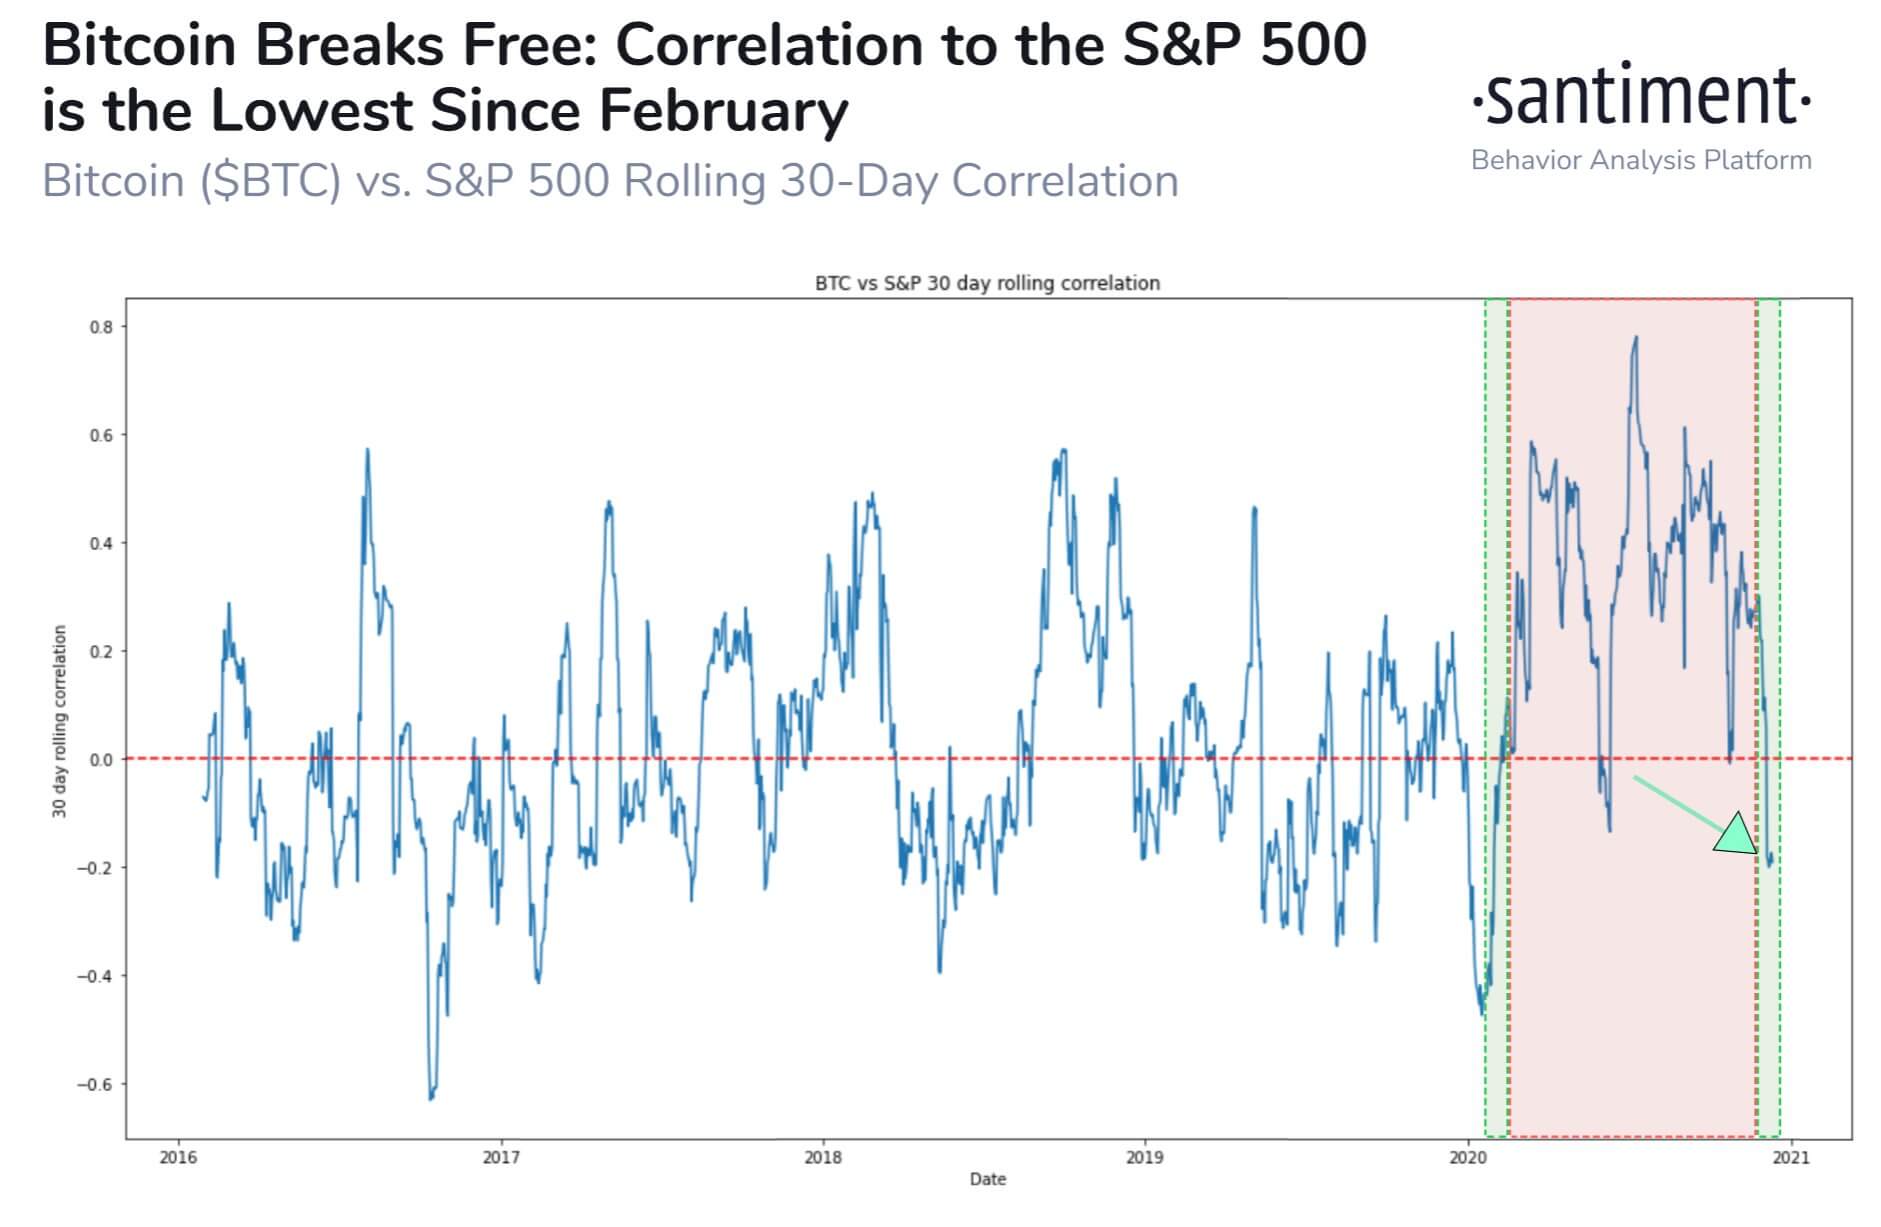
The correlation between Bitcoin (BTC) and the S&P 500 reached a 10-month low, according to Santiment. Historically, this has been a bullish sign for the dominant cryptocurrency.
A low correlation with the S&P 500 is an optimistic factor for Bitcoin because it means BTC is not trailing the broader risk-on market. Analysts at Santiment said:
“The correlation between #Bitcoin and #SP500 $SPX is great for identifying when $BTC can fluctuate independently from traditional markets. We’ve found that #crypto is at its best when this correlation is low… and our 30-day correlation model shows it’s at a 10-month low.”

Why Bitcoin is likely to outperform the S&P 500 in the medium term
Bitcoin’s correlation with the S&P 500 could decline or remain low in the short term for two reasons.
First, the U.S. stock market could correct in a take-profit pullback, while Bitcoin continues to rally.
Second, the U.S. stock market could rally in tandem with BTC, but Bitcoin posts a larger gain over a prolonged period.
Major investment banks, like JPMorgan, believe that the U.S. equities market is in the middle of a bull run. Strategists say that U.S. stocks could pullback in January if longing equities continue to become a crowded trade.
Nonetheless, strategists anticipate the momentum of stocks to spill over into 2021. If so, the latter scenario is more likely where Bitcoin would have to outperform the S&P 500 to maintain a low correlation.
The post-halving cycle remains the most compelling reason for a continued Bitcoin uptrend in 2021 that might allow BTC to outlast the S&P 500.
Bitcoin undergoes a block reward halving every four years. The past two halvings occurred in 2012 and 2016, and after each halving, the price of BTC surged over a long period.
A block reward has historically affected the price of Bitcoin positively because it impacts its scarcity. After each block reward halving, the amount of BTC miners can mine decreases. Hence, there is a lower number of BTC that is produced on a daily basis. Since the supply of BTC is fixed, that makes BTC more scarce.
Bitcoin tends to rally for 12 to 15 months after each halving. Considering that the latest halving was in May 2020, BTC could rally into mid-2021, if past bull cycles follow.

Key technical levels in the near term
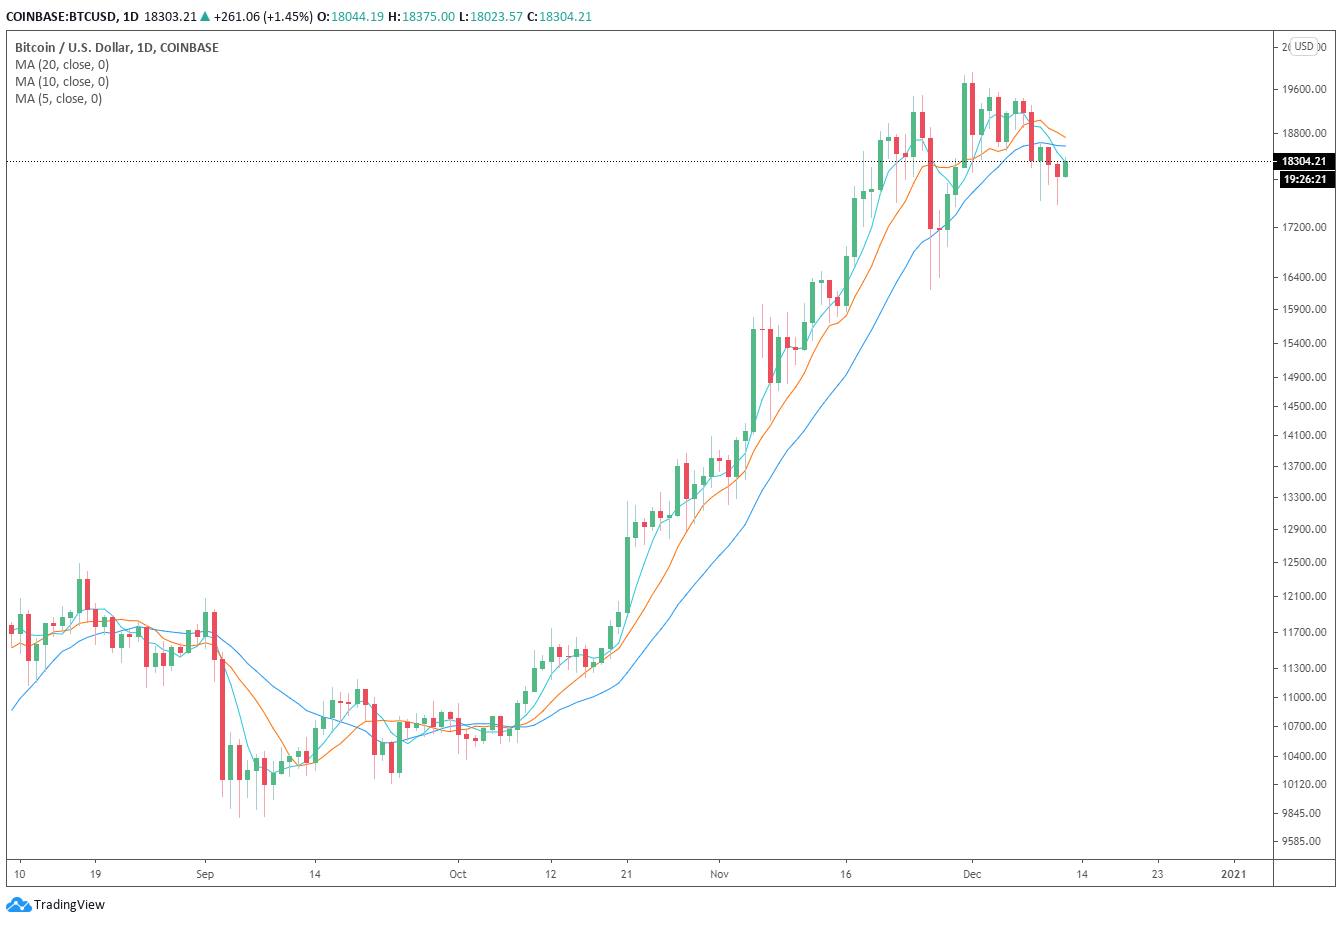
In the near term, the $19,400 resistance level remains the most important technical level.
Bitcoin corrected to $17,600 in the past 24 hours, after three consecutive failed tests to rise above $19,400.
If the price of Bitcoin surpasses $19,400 and remains above it, it would raise the probability for a continued rally above the all-time high.
Whales and miners sold heavily in the past two weeks, and the possibility of high-net-worth investors bidding above $20,000 strengthens as well.
Bitcoin Market Data
At the time of press 1:35 am UTC on Dec. 14, 2020, Bitcoin is ranked #1 by market cap and the price is up 1.39% over the past 24 hours. Bitcoin has a market capitalization of $354.19 billion with a 24-hour trading volume of $25.23 billion. Learn more about Bitcoin ›
Crypto Market Summary
At the time of press 1:35 am UTC on Dec. 14, 2020, the total crypto market is valued at at $559.55 billion with a 24-hour volume of $104.43 billion. Bitcoin dominance is currently at 63.27%. Learn more about the crypto market ›


