 Analyzing bitcoin’s break above $4200, is it a trap?
 Analyzing bitcoin’s break above $4200, is it a trap?

Cover art/illustration via CryptoSlate. Image includes combined content which may include AI-generated content.
The break of the $4,200 resistance level represented a pivot point for bitcoin. Many respected analysts believe the bottom is in for BTC, while a few others predict it could sustain more losses. Whether the former or the latter is right, it’s noticeable that optimism is growing among investors as the market continues to surge—the perfect conditions for a bull trap.
I surveyed notable influencers, analysts and traders for their probability that the bottom is in for this bear market. Here are the results:
95% @woonomic (Adaptive Capital / On-chain Analyst)
90% @jespow (Kraken founder)
90% @arjunblj (Analyst)
85% @novogratz (Galaxy Digital)— Willy Woo (@woonomic) April 22, 2019
Respected Analysts Predict the Bottom
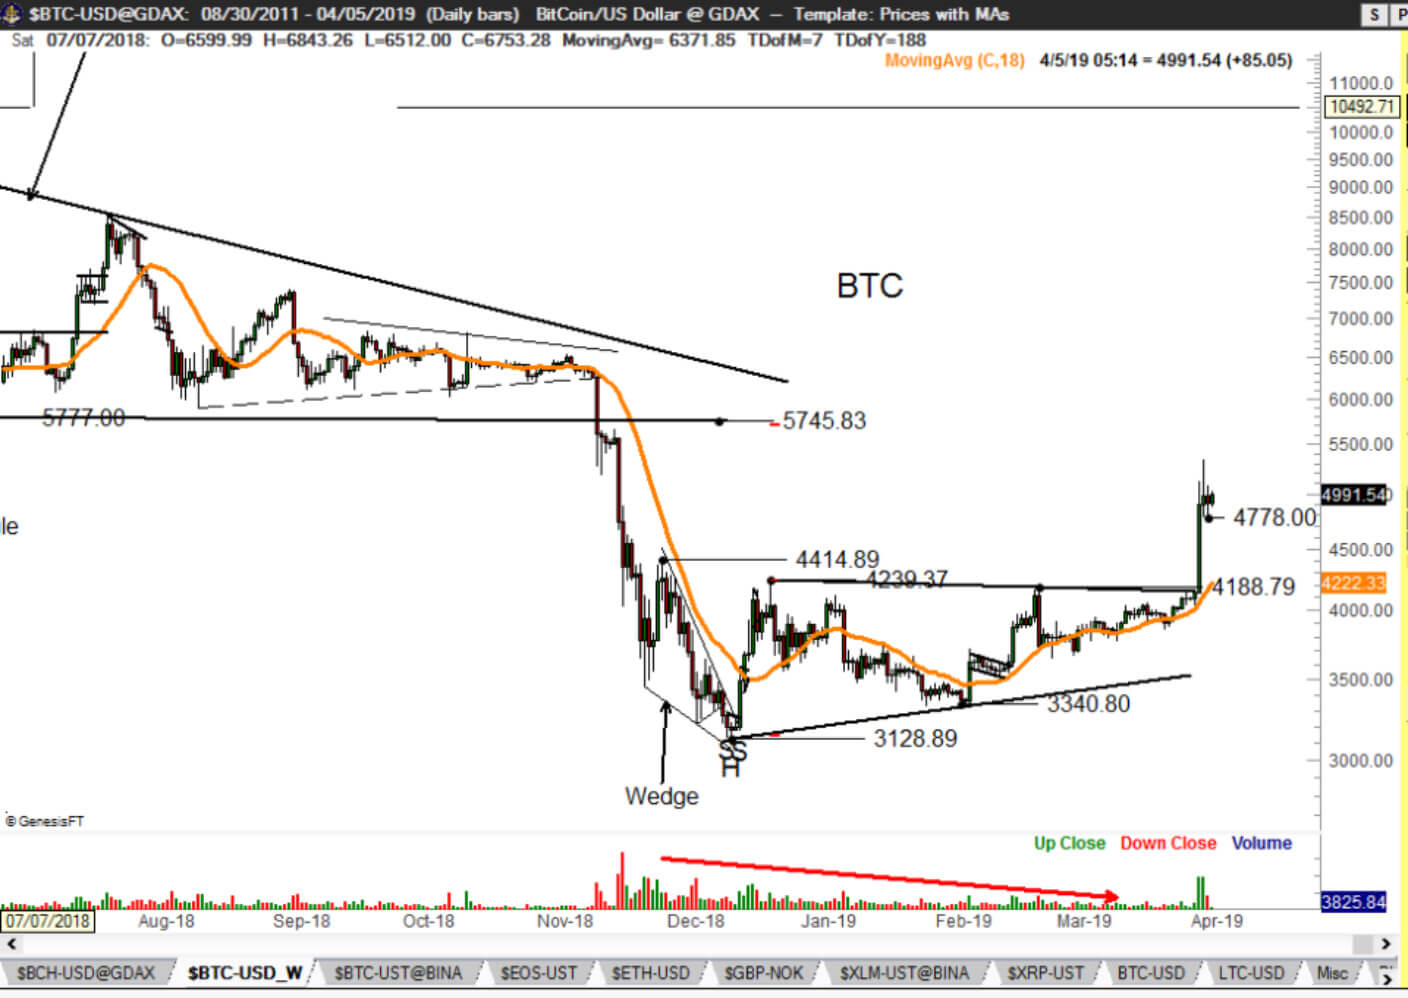
Since the week of Feb. 4, 2019, bitcoin has been going through a bull rally that has taken it from $3,400 to approximately $5,500 after hitting a December low of $3,200. Peter Brandt, a 40-years-trading veteran, suggested this is a sign of a new “parabolic phase.
Either from Dec '18 low or from retest of same (circa analog dbl bottom in 2015) it would not surprise me if $BTC enters a new parabolic phase. $btcusd pic.twitter.com/XV89Qz7P4n
— Peter Brandt (@PeterLBrandt) April 5, 2019
Brandt, the author of “The Diary of a Professional Commodities Trader,” argues that the bullish momentum that BTC has experienced over the last few weeks could have marked the bottom.
“The advance these past couple of weeks decisively completed an ascending triangle bottom. The hard work of catching the major turn might be over—now is the time to be patient in allowing this new bull trend to fully develop.”

Brandt is no stranger to predicting the future valuation of different assets. After the bull run that took Bitcoin to $20,000 in December 2017, he anticipated in early 2018 that it was going to go back below $4,000.
General TA rule — violation of parabolic advance leads to 80%+ decline in value. If general rule is followed, BTC should retrace to <$4,000. Note: This Tweet does not make me a hater. pic.twitter.com/jDNI1osinU
— Peter Brandt (@PeterLBrandt) January 22, 2018
Now the trading veteran sees Bitcoin going to $50,000 but he predicts that a pullback could come first:
“My longer term outlook is whether from the Dec 2018 low or a retest of the same, another massive parabolic advance will occur, taking BTC to $50,000 in the years ahead.”
Big question re: analog year comparison is whether 10a rally will lead to 10b retest similar to 2013-2015 $BTC pic.twitter.com/BCRKSqBxsP
— Peter Brandt (@PeterLBrandt) April 6, 2019
Mayer Multiplier Calls for a Wild 2021
Along the same lines, Trace Mayer, an early crypto investor, has turned bullish. Based on his own indicator, the Mayer Multiple (MM), he thinks that Bitcoin may have hit bottom.
“If history and future rhyme then perhaps 2021 will be a wild year with $100,000 to $250,000 Bitcoin in cards.”
Tea leaf reader @peterlbrandt: new $BTC parabolic move would not surprise him.
Crypto-spring started with @TIPMayerMultple now above 1.0? If history & future rhyme then perhaps 2021 will be wild year with $100-250k $BTC in cards? Thoughts? ? @TuurDemeester @ToneVays @APompliano pic.twitter.com/aS7mJKPhjb
— Trace Mayer (@TraceMayer) April 6, 2019
Mayer’s indicator is the result of dividing the price of BTC over its 200-day moving average. When it goes below the 1.0 boundary point it is indicative of a bear market period, but when it goes above 1.0 it signals a bullish trend reversal as CryptoKrea, a crypto trader and analyst, explains.
The @TraceMayer Mayer Multiple and its move back above 1.0 might have just indicated the bottom of this bear market, just as it successfully indicated the two prior bear market bottoms.#BTC #Bitcoin #Crypto
Thread ?@woonomic @krugermacro @APompliano pic.twitter.com/qhZKJql05V
— CryptoKea (@CryptoKea) April 13, 2019
The MM has been able to successfully predict the past two Bitcoin bear market bottoms and it seems to be painting the same picture once more. This principle encourages Mayer to support Brandt’s idea that the bottom is in and BTC could be preparing for a massive move to the upside.
Calling Bottom on the Bitcoin Misery Index
Since the beginning of 2019 the “King of Cryptos” has definitely revived the bullish sentiment from all over the crypto sphere and Thomas Lee, the head of Fundstrat Global Advisors, is no exception to it.
Mr. Lee believes that Bitcoin could top $10,000 sometime this year:
“If the S&P 500 made a 2.5 standard deviation move [as it has done year-to-date] and investors are looking for vol [volatility] that’s building a base case for Bitcoin.”
The Fundstrat chief analyst makes the case for a market bottom that formed on December’s low of $3,200. The bear market could have ended by means of the Bitcoin Misery Index (BMI), an indicator created by Lee that scores from 0 to 100 how “miserable” Bitcoin investors are based on the coin’s price and volatility. The current BMI value is 89, which is a positive sign because only in bull markets the value is greater than 67.
The Bitcoin Misery Index reached 89 on 4/2. Highest reading since June 2016. Means good and bad.
Good–> Since 2011, BMI >67 only seen during $BTC bull markets. More evidence bull starting.
Bad –> BMI >67 after peak, $BTC falls ~25% = Profit taking ST.#bitcoinmiseryindex pic.twitter.com/X55q2ypiCA
— Thomas Lee (@fundstrat) April 11, 2019
For Thomas Lee, some of the fundamental market forces have converged onto the bullish side so that mainstream adoption will “not be needed for the next bull run.”
Calls for Sub $3,000 Prices
On the other hand, a couple of analysts suspect that the bear market is not over yet and are calling for sub $3,000 prices.
Tone Vays, a former Wall Street analyst, agrees with Peter Brandt that $50,000 could be a reasonable target for Bitcoin’s next bull run, but he differs with the overall sentiment that the bottom is in.
Speaking on Ivan on Tech’s Good Morning Crypto Show, Vays said:
“My worst case scenario target is $1,300. It doesn’t mean that Bitcoin has to get there, but to me $1,300 has been a realistic target for over a year and it remains a realistic target.”
Mr. Vays, a former VP at JP Morgan, thinks that a clear sign that the bear market is over will be given when BTC dominance goes significantly higher. He refers to it as the “Bitcoin decoupling,” which is when the “King of Cryptos” goes up while other coins go down, stay down, or go up very slowly; until that happens, he anticipates lower prices.
“When I see altcoins pump harder with the Bitcoin rally, it tells me that the market has not bottomed and that the bear market is still with us.”
Halving Could Push BTC to New Highs but Lows More Likely First

The creator of CryptoSCam, a podcast about the latest scams in the cryptocurrency sphere, suggests that the upcoming halving could cause a push up in the market valuation of BTC six months prior to the event. However, in the meantime, he’s confident that “sub $3,000 prices are more likely than above $10,000 prices at this point in time.”
Tyler Jenks, the president of Lucid Investments Strategies, also maintains the idea that Bitcoin is heading back lower despite the recent bullish price action.
I have not commented on Bitcoin since we broke up through the $4,000-4,200 resistance zone. I believe we are headed back down to that zone and it will not hold. New lows coming. Target of $1,000 unchanged.
— Tyler Jenks (@LucidInvestment) April 11, 2019
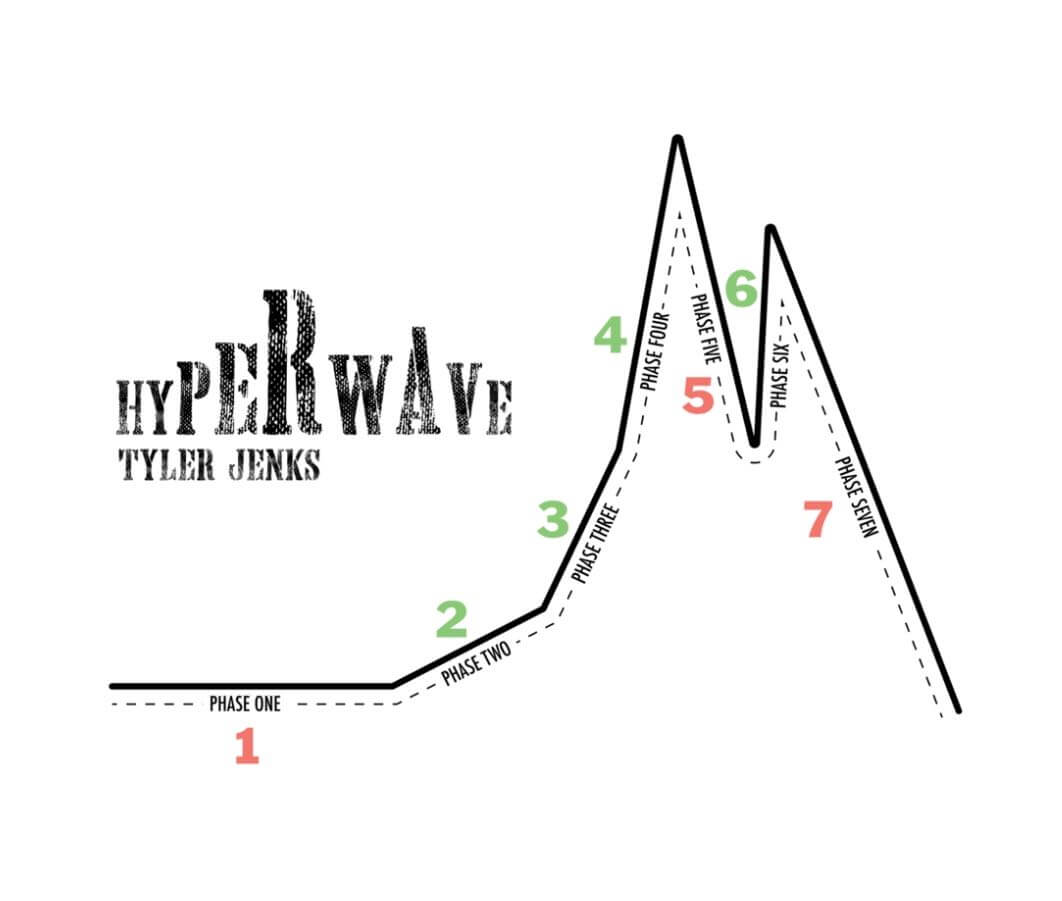
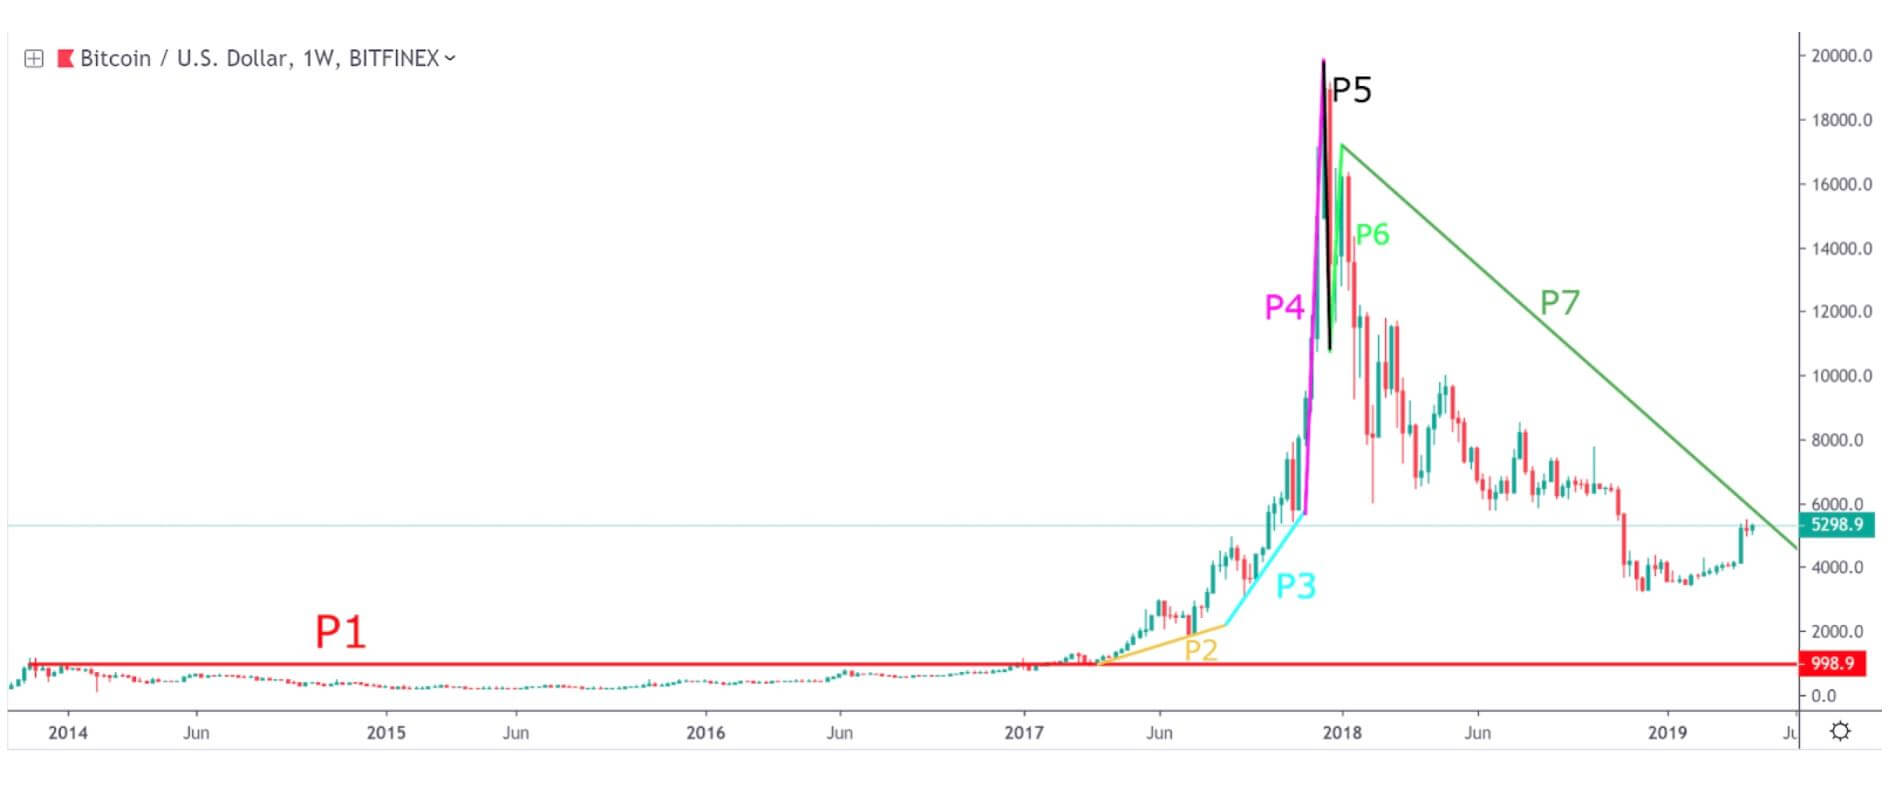
Throughout many years of research, Jenks invented and developed the Hyperwave Theory, which is a technical tool to analyze the outrageous movements taking place in a macroeconomic environment. Based on this theory, a cycle is characterized by seven phases that determine the direction of the trend. After the cycle is completed, the price tends to return to the initial phase that started the movement.

The head of Lucid Investment Strategies thinks that Bitcoin has gone through a Hyperwave cycle and now is on its way to returning to Phase 1, which could happen by rapidly spiking under that level in a wick.

For the long-term future, Jenks believes that the ever-growing debt and the inequality of distributed wealth within regions will soon force an alternative solution and Bitcoin could be one of those. If this cryptocurrency is able to replace sovereign currencies and act as a reserve currency of the world, it could climb up to “$10 million per coin.”
Bull Trap or a Reasonable Bottom?
So whether any of these analysts are right or not, it is reasonable to believe that the market bottom is closer than ever. We have to keep in mind that market bottoms are often defined by panic selling or capitulation and December’s low of $3,200 could have been the first sign of a bottom.
As history tends to repeat itself, one could argue that a similar scenario to what the market is going through right now happened in July 2015. Then, it seemed like the bottom was in and the bear market had ended, but after optimism started growing among investors BTC came back down aggressively liquidating many traders out of their bullish positions.
This type of price action is known as a bull trap, which is basically a false signal that an asset is reversing after a strong rally when in fact it will continue to decline.
Bitcoin Market Data
At the time of press 2:52 am UTC on Nov. 7, 2019, Bitcoin is ranked #1 by market cap and the price is down 0.17% over the past 24 hours. Bitcoin has a market capitalization of $154.24 billion with a 24-hour trading volume of $26.65 billion. Learn more about Bitcoin ›
Crypto Market Summary
At the time of press 2:52 am UTC on Nov. 7, 2019, the total crypto market is valued at at $271.6 billion with a 24-hour volume of $94.7 billion. Bitcoin dominance is currently at 56.79%. Learn more about the crypto market ›


