Cover art/illustration via CryptoSlate. Image includes combined content which may include AI-generated content.
Some of the top altcoins by market capitalization—including TRON, Cardano, and Chainlink—began surging over the last few hours. As they absorb a bigger share of the market it could mark the beginning of a new altseason.
Market dominance
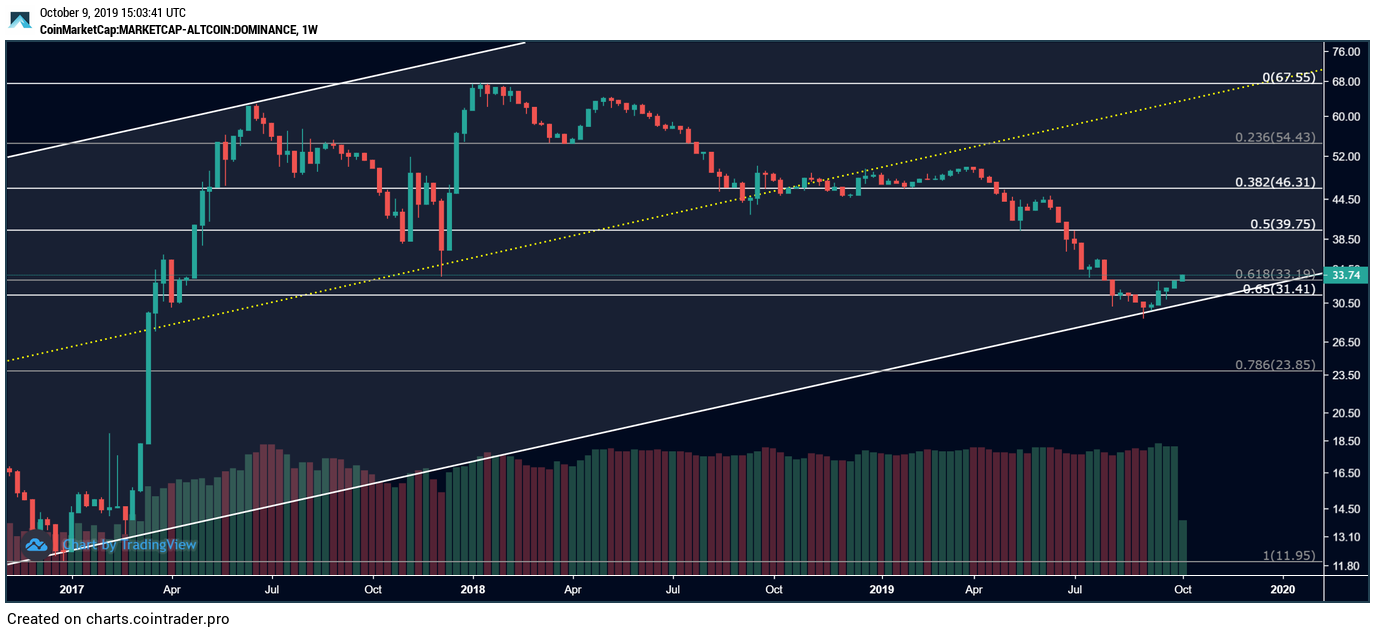
The altcoin market share has mostly been contained within an ascending parallel channel since June 2013. From that point on, every time it reaches the bottom of the channel it bounces off to the middle or the top. But, when it reaches the top it falls back to the middle or the bottom.
On Jan. 13, 2018, altcoin dominance nearly touched the top of the ascending parallel channel and since then it went through a steep correction plummeting over 57 percent. After peaking at a 67.55 percent dominance, altcoins went down to hit the bottom of the channel at 28.78 percent on Sept. 6, 2019. As it was seen before, the bottom of the channel served as a rebound zone, once again allowing altcoin dominance to rise to 18 percent.
Coincidentally, this is also where the 61.8 and 65 percent Fibonacci retracement zones sit. This Fibonacci retracement level is considered by many traders as the ‘golden’ retracement area due to the higher probability of a rebound. The altcoins market share has indeed bounced off this area and now it could be on its way up to regain the 50 percent Fibonacci retracement level as support.
Such a bullish impulse could take altcoins to overtake 40 percent of the market share, signaling a new altseason. Meanwhile, Bitcoin’s dominance will have to pull back to around 60 percent.
Since the beginning of the year, Bitcoin dominance has also been contained within an ascending parallel channel. Due to its inability to recently break above the middle line of the channel, Bitcoin’s dominance is retracing. This correction could take it to the bottom of the channel, where the 23.6 percent Fibonacci retracement level sits at.
A move below this level of support will increase the odds for Bitcoin dominance to test the next level of support around the 38.2 percent Fibonacci retracement level. This coincides with one of the most recent reports by Binance that suggests that BTC dominance will go back to the 60 percent range.
“We still believe in this, partly because BTC dominance was below 60 percent for an extended period, from May 2017 until June 2019. It has only been in the past three months or so that BTC dominance has shot up so dramatically, and the crypto-world has found its way of making everyone feel like a prisoner of the moment. Short-term wise, though, BTC dominance may be sticking around,” reads the report.
Although it is too early to tell whether the next altseason has begun, some of the top cryptocurrencies by market cap have already started moving upward.
Altcoins on the run
Ethereum, for instance, is up nearly 7 percent after breaking out of a no-trade zone where it had been sitting since Sept. 30. This range was defined by the $182.80 resistance level and the $166.70 support level. Now that ETH moved to the upside, it reached the first price hurdle at $195. And, it could continue ascending to hit the next level of resistance at $205.
Along the same lines, Bitcoin Cash rose 4 percent after it moved above the $232 resistance level. A further spike in volume could take BCH to $271 or even $292.
Litecoin was also sitting in a no-trade zone after the 25 percent plunge it experienced on Sept. 24. But, it now seems to be on its way up to $64 or $71.
CryptoSlate Daily Brief
Daily signals, zero noise.
Market-moving headlines and context delivered every morning in one tight read.
5-minute digest 100k+ readers
Free. No spam. Unsubscribe any time.
Whoops, looks like there was a problem. Please try again.
You’re subscribed. Welcome aboard.
Following a two weeks consolidation period, Binance Coin appears to be breaking out as well. This crypto is currently up 8 percent from the $16.40 barrier that was containing its price. If it continues rising it may find resistance around $18.30 and $20.
Finally, Ontology’s price action is behaving similarly to the cryptocurrencies previously analyzed. This crypto appears to be surging and could likely hit $0.685 or $0.774 soon.
Biggest gainers
As most of the top cryptocurrencies by market cap consolidated following the drop of Sept. 24, two of them were able to outperform the rest of the market.
After hitting a low of $0.012 on Sept. 24, TRON quickly recovered and is currently up 50 percent. Nonetheless, in its 12-hour chart a spinning top candlestick pattern appears to be developing. This candlestick formation could be signaling a trend reversal. If validated, TRX could go down to $0.015.
Additionally, Chainlink reached a low of $1.48 on Sept. 24 and surged over 100 percent since then. Now, the TD sequential indicator is presenting a sell signal (in the form of a green nine) on its 12-hour chart estimating that a retracement is underway. If confirmed, the selling pressure behind LINK could increase, taking it to test the next level of support around $2.20.
Overall sentiment
As seen in this technical analysis, some of the top cryptocurrencies by market capitalization are starting to resume their bullish trends. Even though most of them surged between 4 and 8 percent over the last few hours, others have seen significant gains in the last two weeks. If history repeats itself, altcoin dominance could soon try to go up to capture 40 percent of the market share.