 Comparing Ethereum and NEO blockchains by the numbers
 Comparing Ethereum and NEO blockchains by the numbers

Cover art/illustration via CryptoSlate. Image includes combined content which may include AI-generated content.
With several large projects racing to overtake Ethereum as the leading smart contract blockchain NEO frequently pops up as a front runner. While many call the project the “Chinese Ethereum,” recent data shows that the ambitious project still has a long way to go before it can challenge the incumbent.
The Future of NEO
Once dominated by Bitcoin, the cryptocurrency space is becoming a highly competitive industry. With decentralization in mind, new projects are appearing in the market on an almost daily basis. While most of them go by largely unnoticed an outlier occasionally appears that gains enough momentum to potentially challenge the biggest name in blockchain applications—Ethereum.
One of those projects is NEO, which has been likened to the “Chinese Ethereum.” After going through a complete rebranding process in 2017. Formerly known as Antshares, the company hit the market and started operating in China in 2014. Just a year after its launch, the market was already predicting a bright future for the Chinese company, with many saying it has the potential to be one of the top coins in the next few years—which it has so far achieved as it has consistently been in the top 20 by market cap.
The platform’s framework provides multiple programming languages and emphasizes ease of development for smart contracts. This year the company opened an office in Seattle, Washington, to leverage local talent fostered by Microsoft and Amazon to further compete on the dimension of ease-of-use for developers.
However, the NEO protocol is vastly different from Ethereum and comparing the two can be difficult considering they both use different consensus protocols and have different objectives. That said, there are still some meaningful comparisons.
Head to Head Data Comparison
In theory, no forks are possible on the NEO blockchain. The gas on the network is paid in a separate gas token completely different from the NEO token. The NEO token has a 100 million supply limit, which is regulated by limited inflation of 50 million developer tokens released over time. Ethereum, on the other hand, has no supply limit.

The NEO project currently has 203 commits made by just 32 contributors. Ethereum, on the other hand, has had over a thousand commits to its GitHub code made by over 100 developers. Based on an analysis conducted by one VC firm, Ethereum continues to lead crypto projects in terms of the breadth and activity of its software development.
NEO is considered highly centralized because it only utilizes a handful of nodes and NEO-related entities control over 50 percent of the tokens for the platform. However, Da Hongfei has said in an interview with CryptoSlate that the organization plans to decentralize over time while leveraging its current structure to outmaneuver other slower, more bureaucratic blockchain projects.
Meanwhile, Ethereum is one of the most decentralized projects in the ecosystem, perhaps only second to Bitcoin according to several respected experts in the field. Ethereum boasts thousands of nodes and a highly active open-source developer community facilitated by a respected non-profit organization, the Ethereum Foundation.
There are also many more users on the Ethereum platform, which is correlated to the number of transactions and other measurable factors. According to ConsenSys, the Ethereum network has processed a total of over 353 million transactions at the end of 2018. NEO has only had 22 million transactions to date.
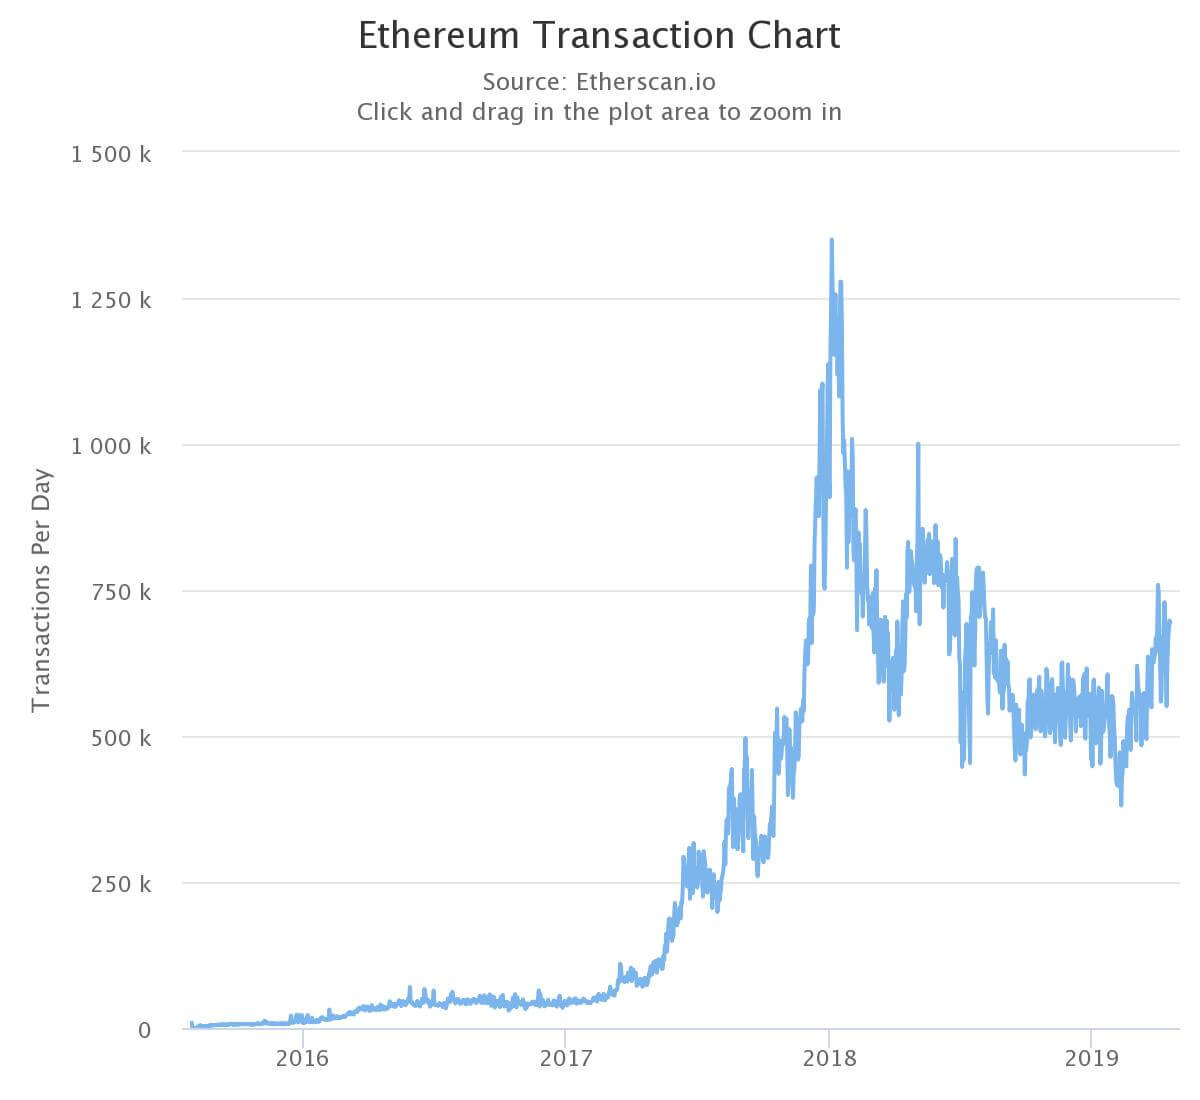
Ethereum also dominates NEO when it comes to the number of daily transactions it handles. With an average of 664,000 transactions per day, Ethereum’s transaction volume is 67 times larger than that of NEO’s, which handles an average of 9,800 transactions per day. NEO’s user base is also much smaller than that of Ethereum, showing less than 2 percent the number of active addresses when compared to ETH.
"NEO is the Chinese Ethereum" was the catchphrase during its 2017/18 run-up. Let's take a deeper look.$ETH has:
67x daily transactions
63x active addresses
+84% vs. NEO price YoYYoY changes:$ETH tx's +8%, active addresses -11%$NEO tx's -55%, active addresses -58% pic.twitter.com/m49mD05ifN
— Ceteris Paribus (@ceterispar1bus) April 16, 2019
With that mind, in absolute terms, NEO can theoretically handle a larger number of transactions because of its delegated Byanztine-fault tolerant (dBFT) consensus. By using a much smaller number of nodes, similar to EOS and TRON, NEO is able to process many times more transactions per second when at maximum capacity.

When it comes to year-on-year gains, both ETH and NEO experienced significant losses. While NEO lost over 85 percent of its USD value from Apr. 20th, 2018, ETH’s value decreased by only 70 percent. When looking at the number of coins needed to purchase one BTC, ETH lost half of its value while NEO lost 75 percent of its value relative to bitcoin.

This data comparison shows that, while launched with an ambitious goal, NEO has a long way to go before it establishes the lead Ethereum has gained so far.


 CoinGlass


 Farside Investors


