New growth in top stablecoin supply could signal a return of on-chain liquidity
A surge in stablecoin supply ignites hope that it may serve as a boost to the Bitcoin market.
Quick Take
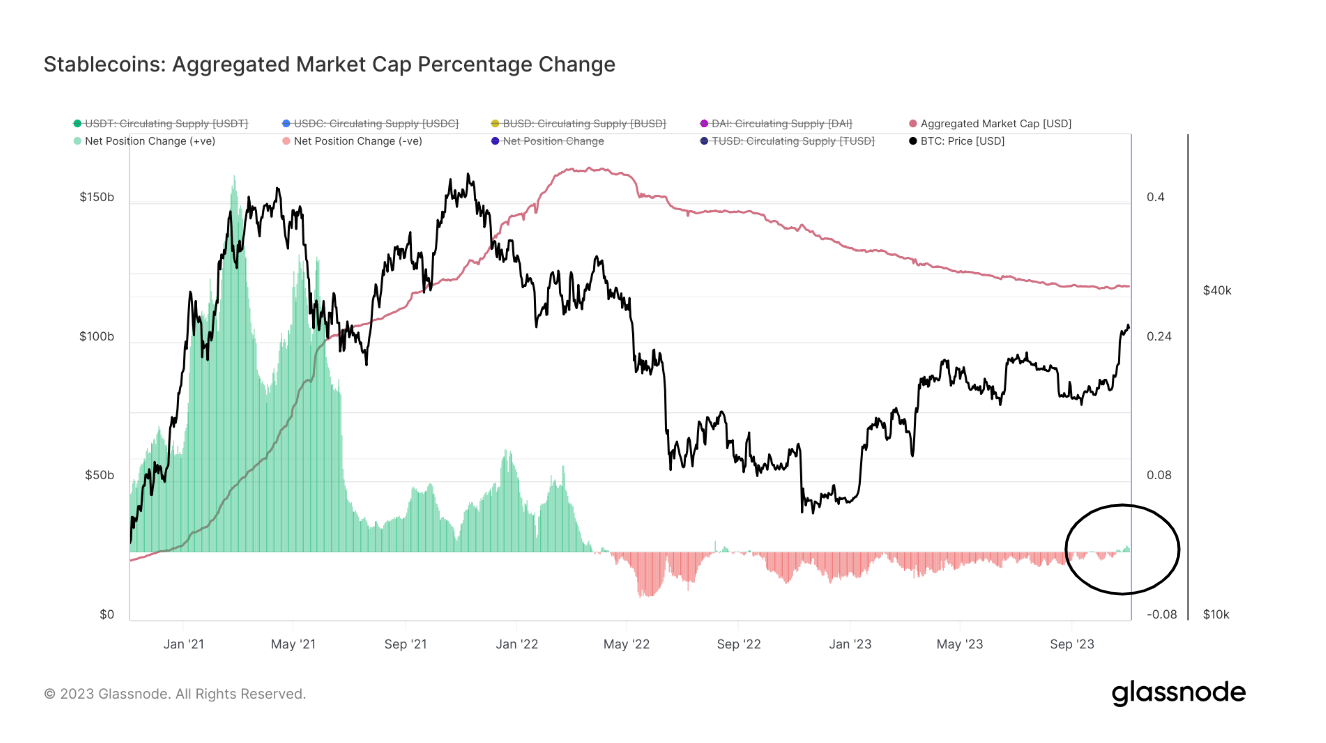
The recent data highlights a return to growth in the supply of the top five stablecoins – USDT, USDC, BUSD, TUSD, and DAI – after a period of contraction.
In the wake of the 2021 bull run, the aggregate supply of these stablecoins skyrocketed from a modest 25 billion to a staggering 162 billion by Feb. 2022. The tide turned, however, and the supply dwindled, mirroring the downturn of Bitcoin (BTC) in 2022. Currently, the combined supply of the top five stablecoins is approximately 120 billion.
For the first time since April 2022, the supply of these leading stablecoins has begun to swell again, with the inflection point occurring on Oct. 19. Intriguingly, this expansion coincided with a surge in Bitcoin, suggesting a potential return of on-chain liquidity after a protracted bear market. This could provide Bitcoin with a much-needed buoy.
CryptoSlate's recent observation further corroborates this notion: the influx of stablecoins into Bitcoin was a major catalyst propelling Bitcoin past the $30,000 mark in October. Therefore, tracking this trend of stablecoin supply growth could be vital in forecasting Bitcoin's market dynamics.
Clearly, USDT constitutes a substantial 70% of the market capitalization of the top five stablecoins, accounting for 85 billion. Recently, CryptoSlate reported on the reduced supply of two of these, BUSD and USDC.
However, DAI presents a different story with its circulating supply of 5.3 billion, which appears to have reached its lowest point this year at approximately 4.4 billion. Meanwhile, TUSD has continued to experience a surge, currently standing at a robust 3.3 billion.