Historical data reveals April’s first week as Bitcoin’s Achilles’ heel
Over $200 million liquidated as Bitcoin enters its worst-performing week of the year.
Quick Take
Bitcoin closed March on a strong note, achieving its highest monthly and quarterly closing prices above $70,000. The leading digital asset by market cap has experienced significant growth in 2024, with a year-to-date rally of over 57%, driven by increasing institutional adoption and investor interest.
However, the new quarter started with a sudden downturn as Bitcoin fell to $69,000 on Apr. 1, resulting in over $218 million in liquidations across the digital asset market in the past 24 hours, as reported by Coinglass.
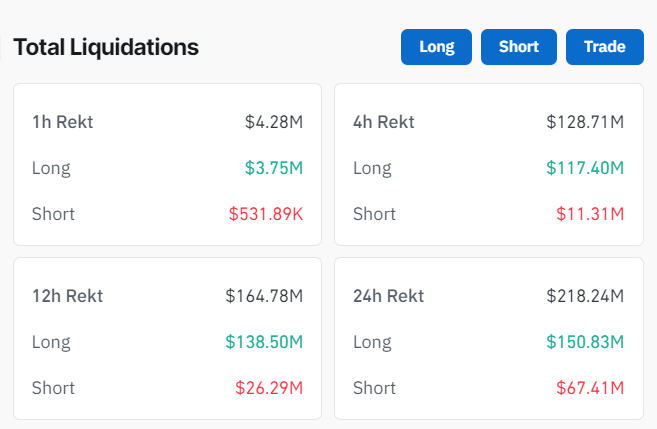
According to Coinglass data, out of the $218 million liquidated, $151 million was attributed to long positions being wiped out, while the rest stemmed from short positions being liquidated. Liquidations happen when an exchange closes a trader's leveraged position due to either partial or total loss of the trader's initial margin.
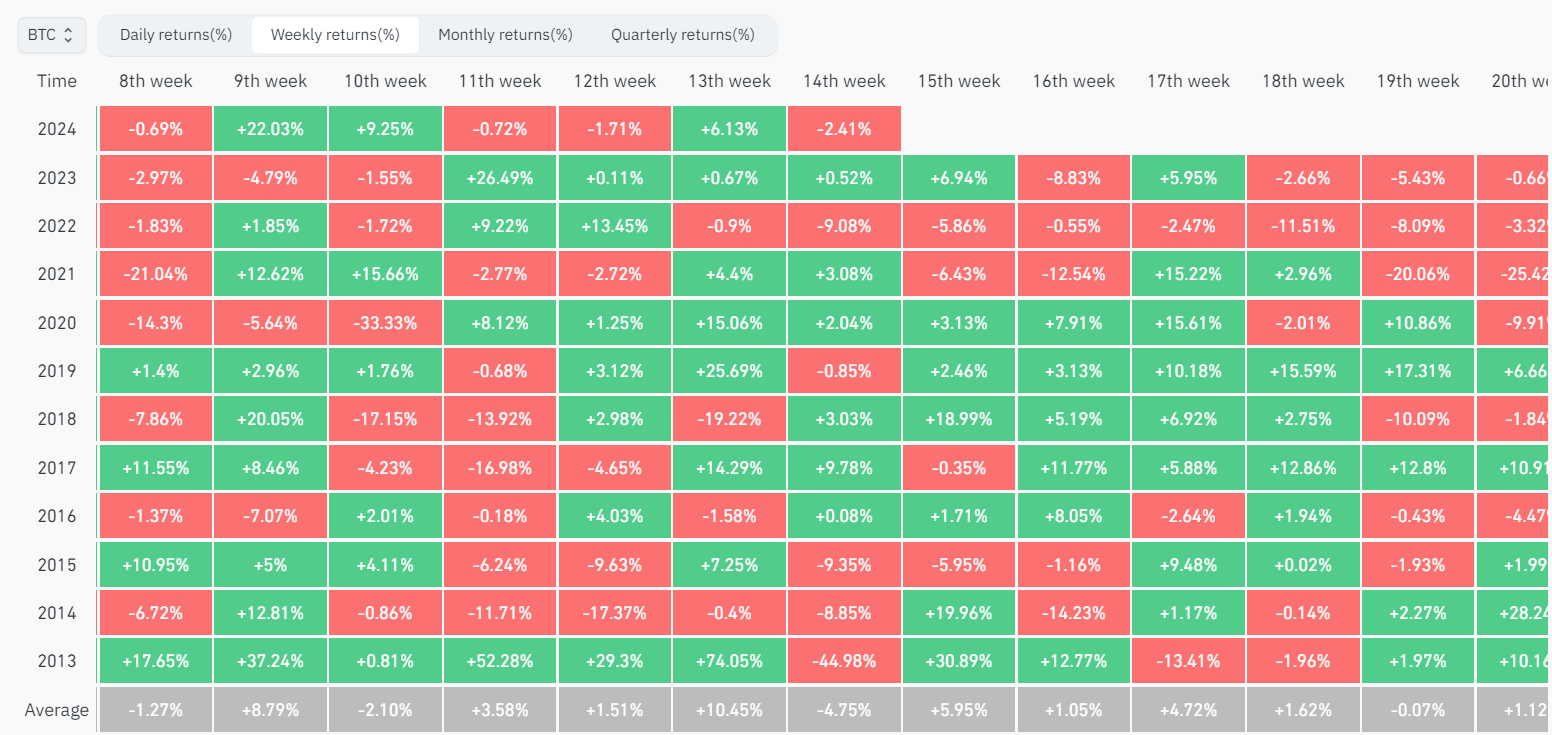
Coinglass data shows that Bitcoin is currently down only 2.4% so far in the 14th week of 2024. However, historically, this week has been the worst performing for Bitcoin compared to any other week on the calendar. Data shows that since 2013, Bitcoin has averaged a 4.75% loss during the 14th week, making it consistently the least favorable week of the year for the benchmark digital asset. The majority of these negative returns were concentrated in the years 2013-2015.