 Research: Self-custody continues to grow as Bitcoin withdrawals outpace deposits
 Research: Self-custody continues to grow as Bitcoin withdrawals outpace deposits
The number of exchange withdrawals surpassed the number of exchange deposits, pushing Bitcoin's illiquid supply higher. This bullish metric shows investors are planning to hodl the coins they accumulated during the winter.

Cover art/illustration via CryptoSlate. Image includes combined content which may include AI-generated content.
Exchange-related deposits and withdrawals of Bitcoin are often good indicators of market sentiment.
When the number of exchange deposits grows, the liquid supply of Bitcoin grows and shows the market’s readiness to trade. Conversely, when the number of exchange withdrawals increases, investors seem less interested in trading and are looking to hold their BTC off exchanges.
Looking at these exchange-related transactions against the total number of Bitcoin transactions can show whether the market is gearing up for a bull run.
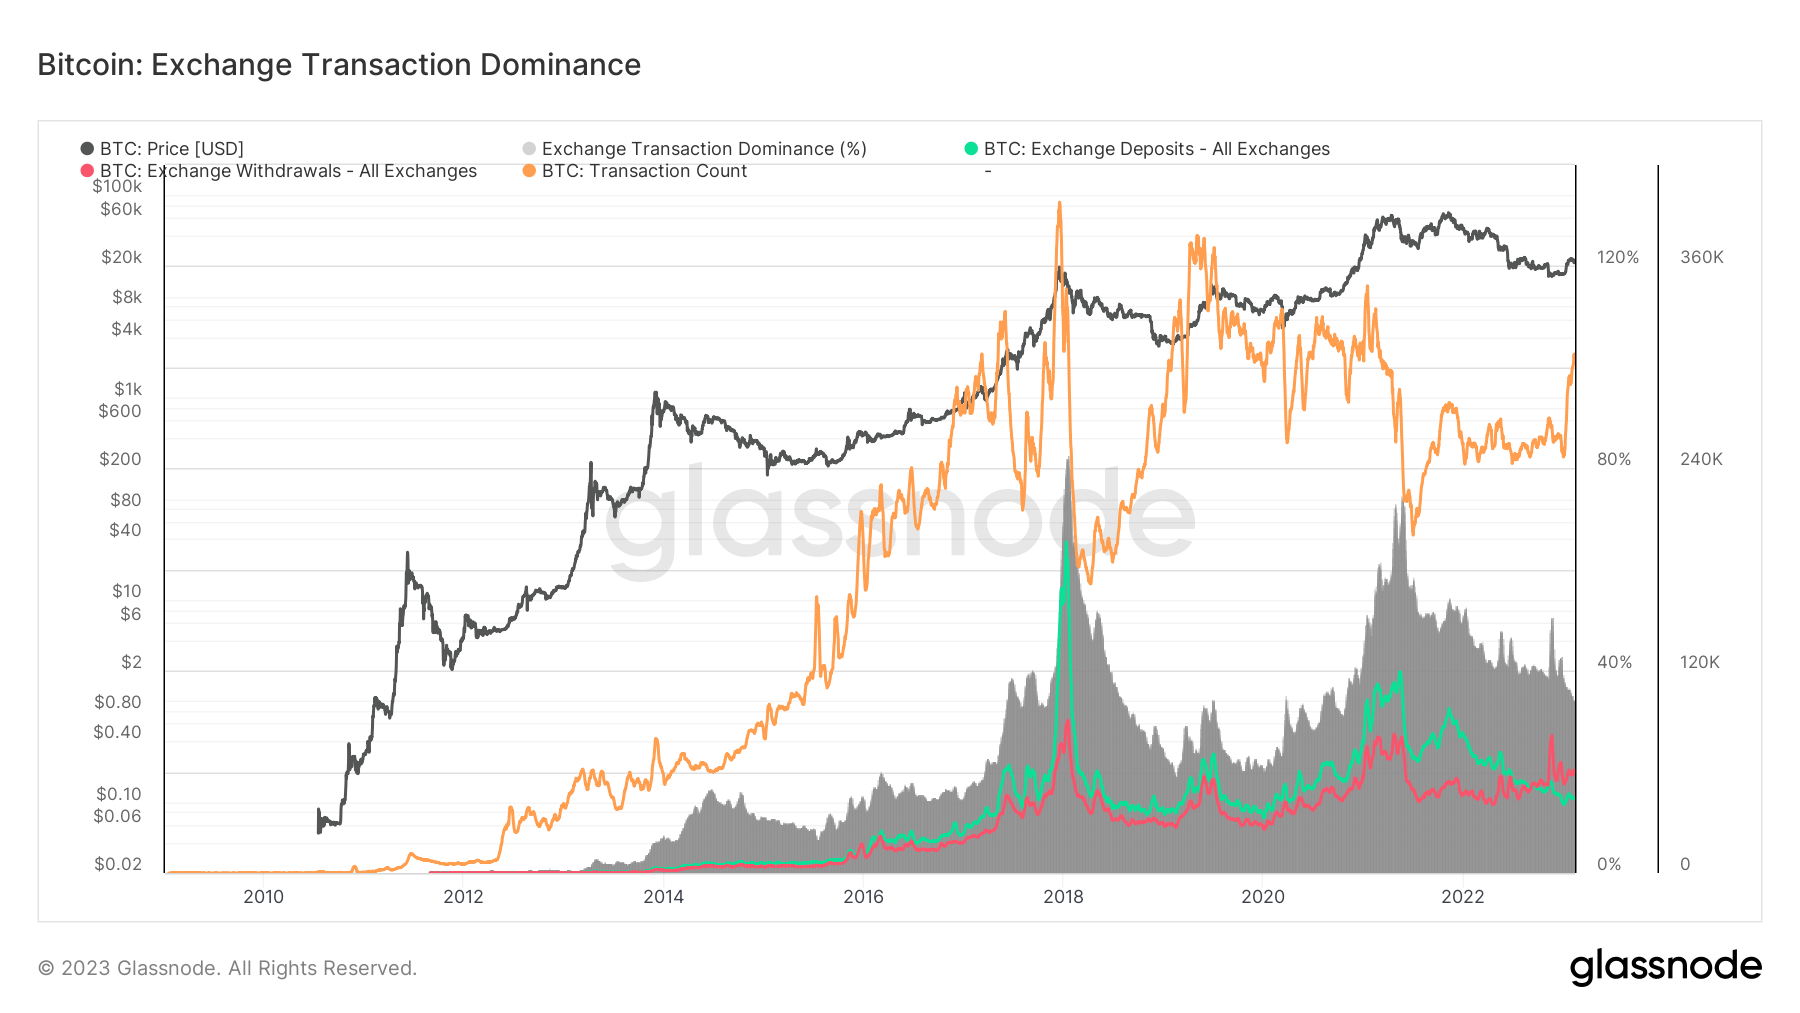
In February 2023, the total number of Bitcoin transactions surpassed 307,000, reaching a two-year high, data analyzed by CryptoSlate shows,
Previous transaction number peaks correlated with Bitcoin’s price rallies. The 400,000 transactions recorded in late 2017 helped fuel the bull run that pushed Bitcoin to its all-time high of $20,000. Around 80% of all Bitcoin transactions at the time were exchange-related, with the majority being exchange deposits.
Subsequent jumps in transaction numbers followed the same pattern — a growing number of transactions fueled a bull run that entered into a correction once the transaction numbers peaked. Both exchange deposits and withdrawals saw notable increases, with deposits surpassing withdrawals.
The previous transaction number high recorded in early 2021 repeated the pattern. However, Bitcoin’s price began rising even after the number of transactions peaked, indicating that the bull run experienced throughout the year was fueled by derivatives.

Since 2014, the dominating trend was for exchange deposits to outpace withdrawals. This trend was broken in September 2022, when withdrawals outpaced deposits – September 2022 saw 53,000 BTC withdrawn, and 52,000 BTC deposited to exchanges.
This trend has only gotten stronger since the collapse of FTX. In November, withdrawals reached 81,000 BTC as investors raced to take their coins off centralized exchanges. On Feb. 11, 44,000 BTC was deposited onto exchanges, while 61,000 BTC left exchanges. The discrepancy between withdrawals and deposits shows that investors are continuing to take ownership of the coins they acquired during the bear run.
The decreasing dominance of exchange transactions further confirms this — less than 35% of all Bitcoin transactions in February were exchange-related.
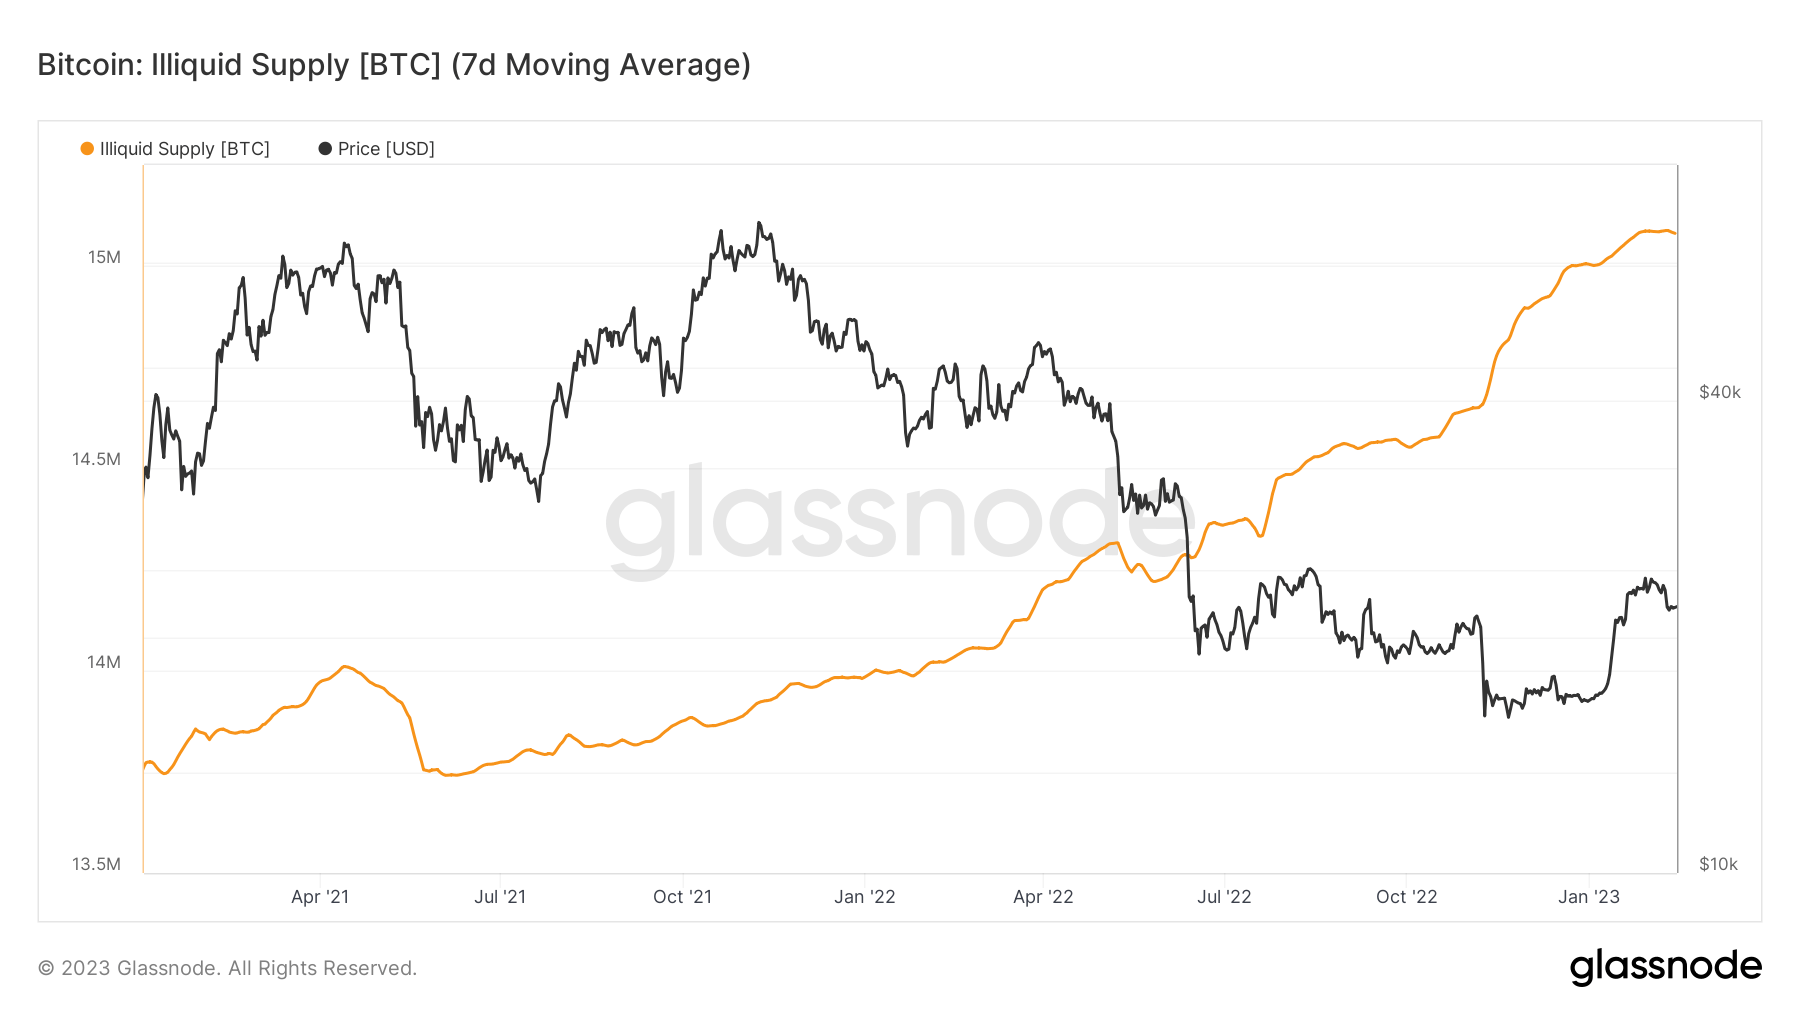
With a large number of BTC now being taken off exchanges, Bitcoin’s illiquid supply has seen significant growth. Put simply, the liquidity of Bitcoin’s supply shows the number of coins actually available for buying and selling. A growing number of illiquid Bitcoins (i.e., coins in cold storage and dormant coins) is often seen as a strong bullish signal as it shows strong investor holding sentiment.
Data analyzed by CryptoSlate showed a sustained increase in Bitcoin’s illiquid supply that began in September 2021.


