 Research: BTC price surge increases miner profitability, indicating market bottom
 Research: BTC price surge increases miner profitability, indicating market bottom
The Difficulty Regression Model and Miner Revenue vs. Yearly Average comparison metrics indicate a market bottom as the hash rate reaches ATH.

Cover art/illustration via CryptoSlate. Image includes combined content which may include AI-generated content.
Glassnode data analyzed by CryptoSlate analysts suggests that rising Bitcoin (BTC) price also increases miner profitability and revenue, which have been historical pointers for market bottoms.
CryptoSlate looked into the Difficulty Regression Model and Miner Revenue vs. Yearly Average comparison metrics to evaluate miners’ profitability. While both metrics agree that things are going swimmingly for BTC miners, the ASIC Rig profitability metric revealed that the hash rate reached a new all-time high.
Difficulty Regression Model
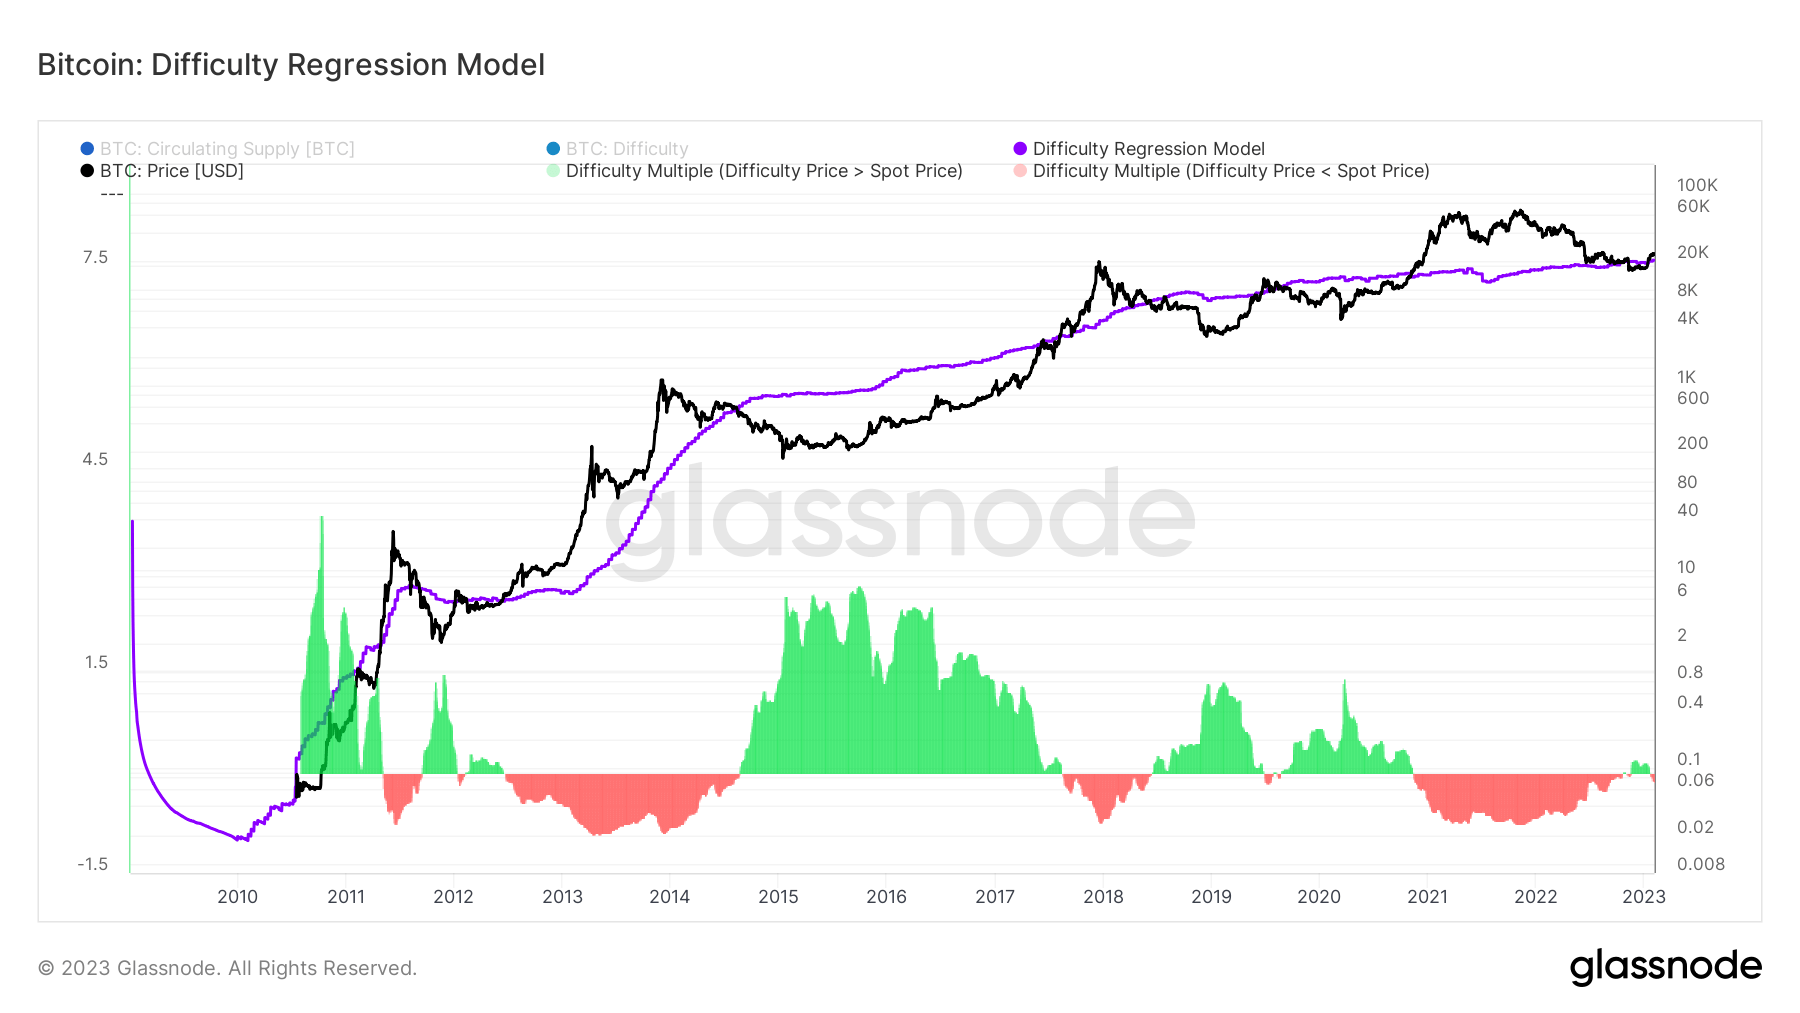
The Difficulty Regression Model is used to make sense of the all-in-sustaining cost of producing one BTC. It takes mining difficulty as the ultimate distillation of the cost of mining, accounting for all the mining variables in one number. Therefore, the calculated value reflects an estimated average production cost for mining one BTC.
The chart below shows the Difficulty Regression Model for BTC since 2010 with the purple line and the price of BTC with the black line. BTC mining becomes profitable when the purple line indicates a cost lower than the BTC price, which is illustrated in the red areas below. Similarly, if the purple line exceeds the black one, it means that BTC mining is not profitable, which creates the green zones on the chart.

Currently, the data shows that the all-in-sustaining cost of producing one BTC is $20,000. This is a slightly lower value than the current BTC price, which lingers around $23,554 at the time of writing.
In addition to mining profitability, the chart demonstrates the historical relationship between the all-in-sustaining cost of producing one BTC and the market bottoms. Since 2010, the all-in-sustaining cost of producing one BTC marked a lower value than the BTC price on five different occasions in 2011, 2012, 2018, 2019, and 2021, all of which were followed by an increase in the BTC’s value. Historically, it can be said that this situation might signal a market bottom.
Miner Revenue vs. Yearly Average
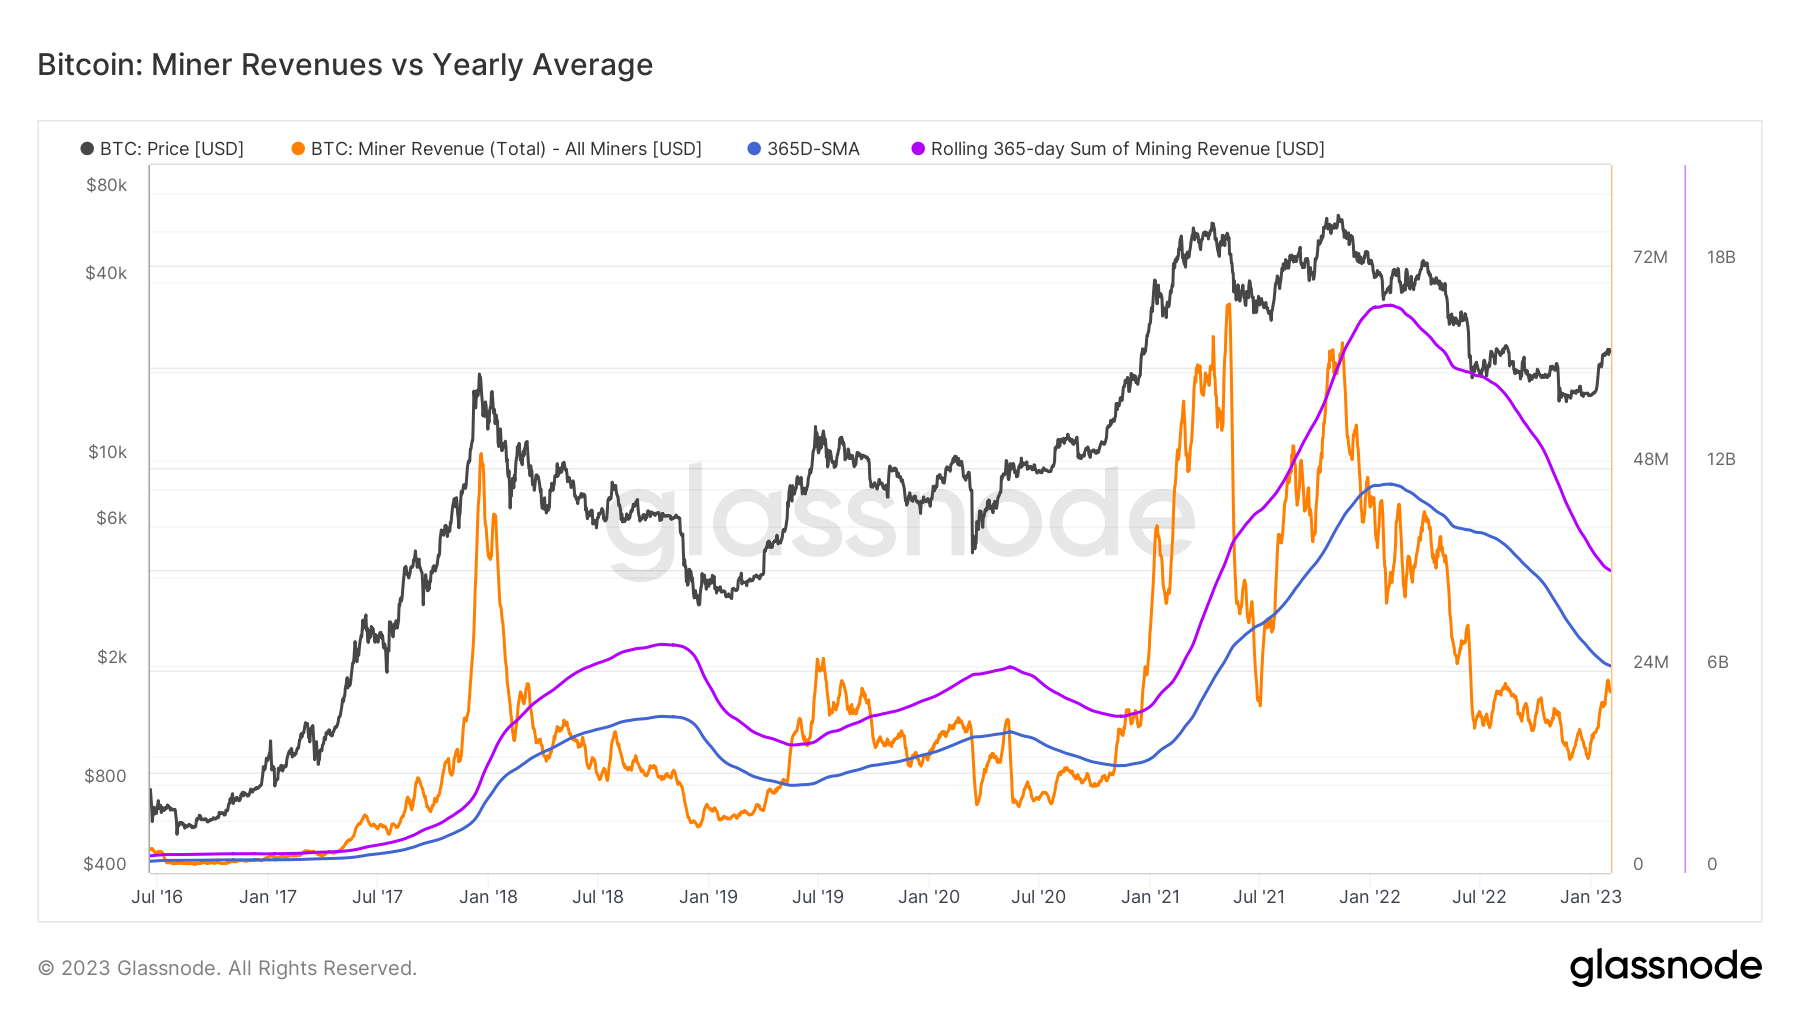
The Miner Revenue vs. Yearly Average comparison is used by analysts who want to measure daily volatility against a longer-term trend. This metric takes the total daily revenue generated by BTC miners in U.S. dollars and compares it to the 365-day simple moving average.
The chart below starts from mid-2016 and represents the total revenue paid to miners and the 365-day simple moving average with the orange and blue lines, respectively.

The aggregated revenue generated by miners has been below the 365-day simple moving average level since the beginning of 2022. According to the chart, the total revenue generated by miners is currently around $22.5 million, while the 365-day simple moving average is roughly $24.6 million.
This relationship also indicates market bottoms. A BTC price surge was recorded whenever the aggregate revenue created by miners exceeded the 365-day simple moving average. The data also shows that the miners’ income has been increasing since the beginning of 2023. If the increase continues, the aggregate revenue might break through the 365-day simple moving average resistance, greenlighting a market surge.
ASIC Rig Profitability
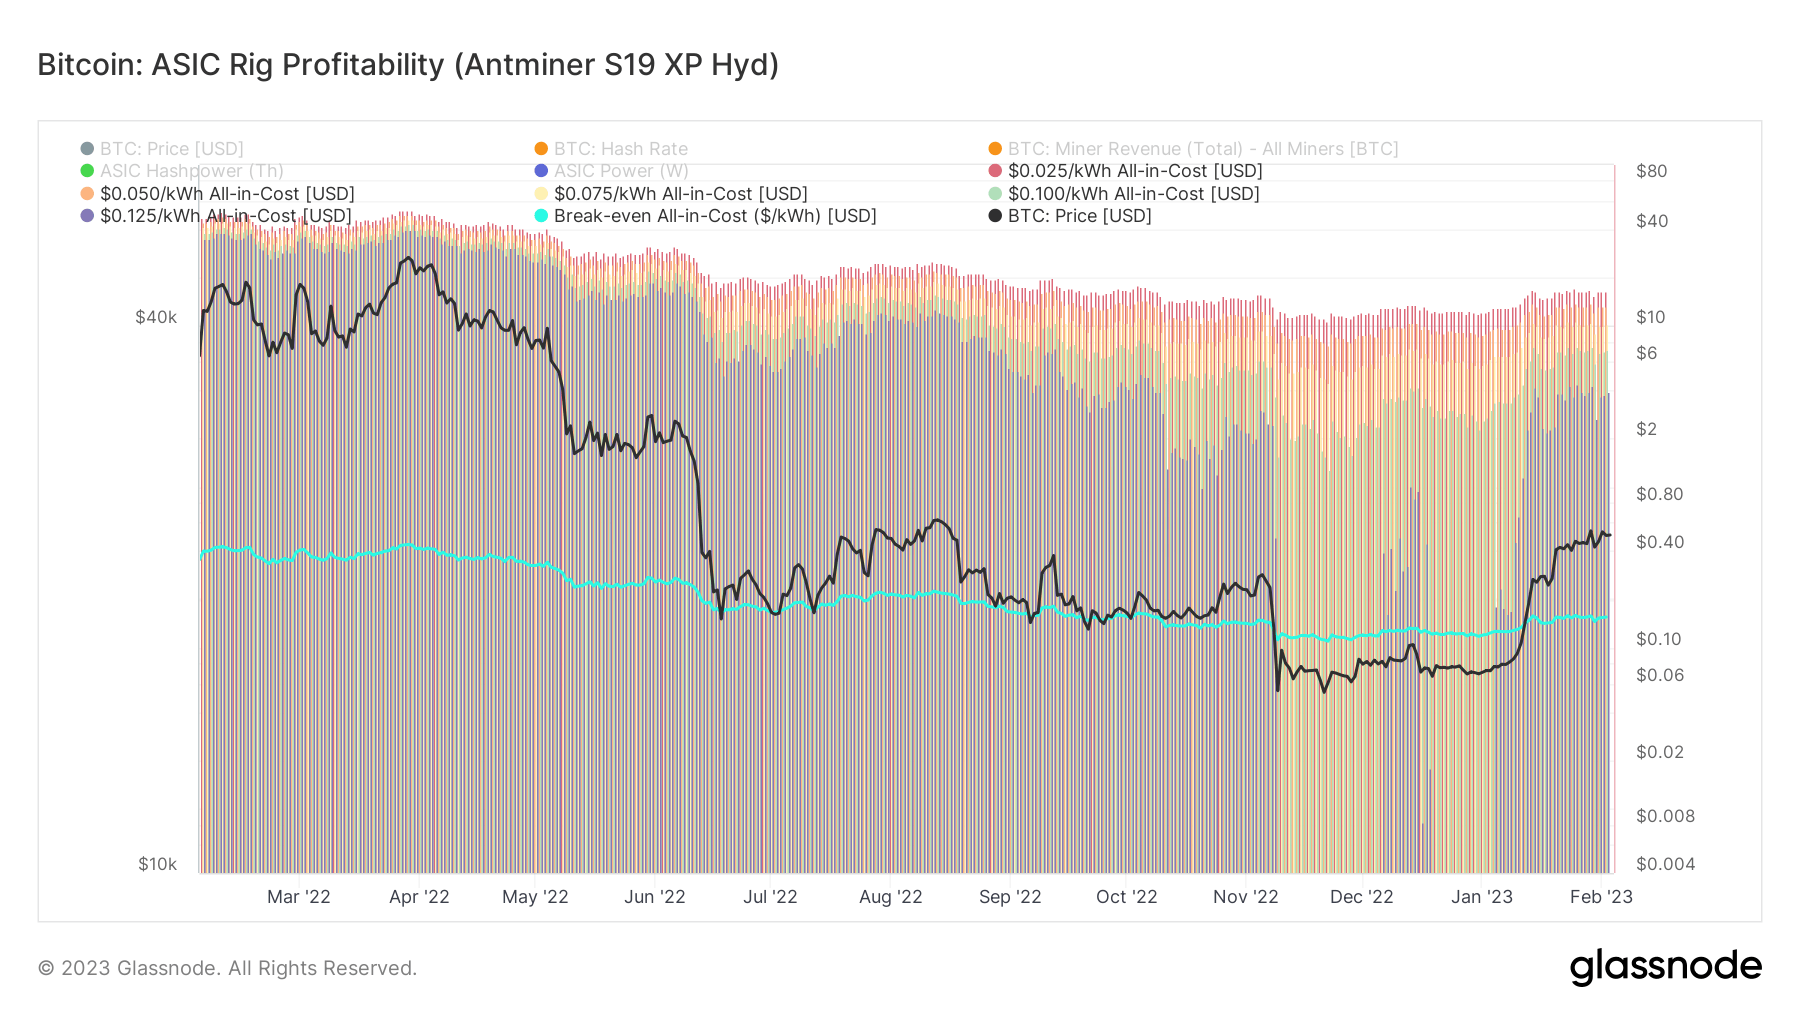
This metric estimates a U.S. Dollar value for the denominated daily profit earned by an Antminer S19 XP Hyd ASIC rig under various all-in-sustaining-cost AISC assumptions.
The Antminer S19 XP Hyd ASIC rig was released in October 2022 and can reach 255 Th/h hash rate, consuming 5304 watts.
The chart below shows the ASIC Rig Profitability for BTC since the beginning of 2022 with the turquoise line. The line indicates profitability if it marks a point lower than the BTC price.

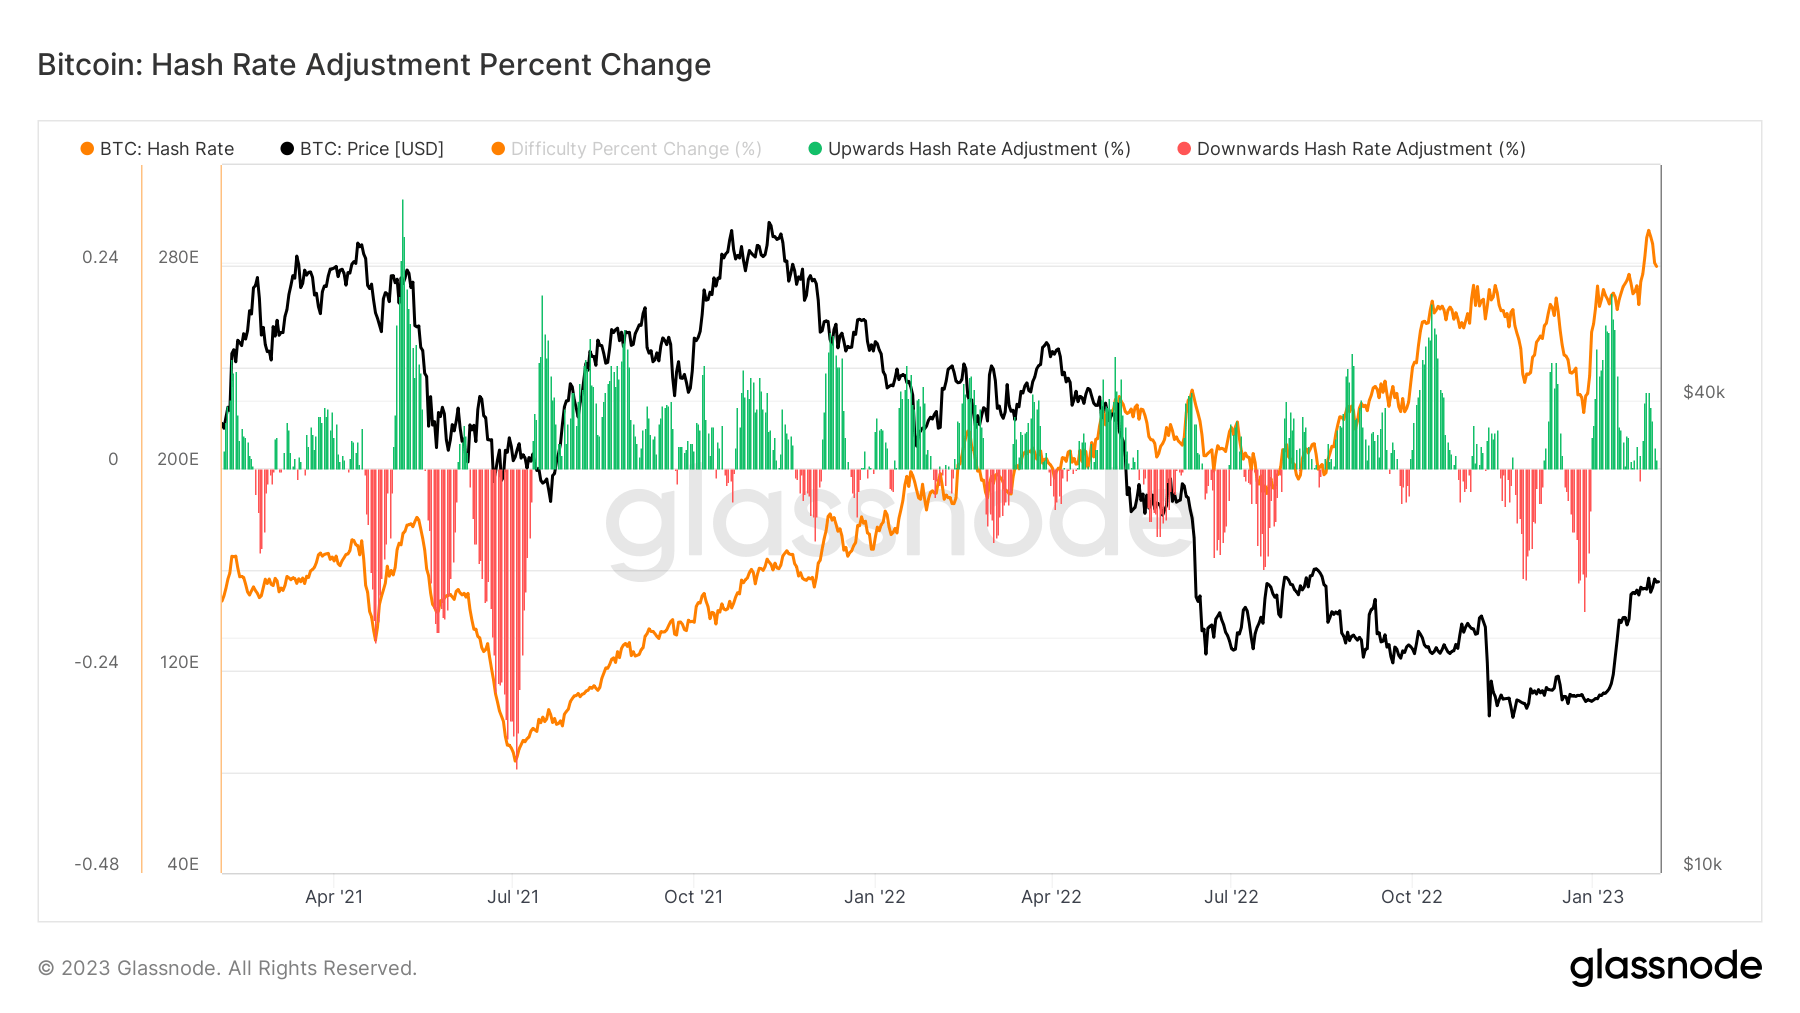
According to the chart, the Antminer S19s have become profitable at the beginning of 2023. The all-in-sustaining cost sits at roughly $0.15. This caused miners to turn back on the Antminer S19s rigs, which increased the hash rate to the point of a new all-time high.

The chart above represents the BTC hash rate with the orange line since the beginning of 2021. The hash rate has been growing exponentially since the beginning of 2023, which has also been strengthening network security.


