 Research: A look at how long-term holders determine end of bear markets
 Research: A look at how long-term holders determine end of bear markets
CryptoSlate analysis found that while the market might be firmly out of capitulation, it still lacks the confidence to enter into a full-blown rally.

Cover art/illustration via CryptoSlate. Image includes combined content which may include AI-generated content.
Defined as addresses that have held Bitcoin for over 155 days, long-term holders are often considered the backbone of the market. They create support as they tend to accumulate BTC when prices are declining, and fuel bull rallies as they distribute the accumulated coins when the market is in an upswing.
Therefore, determining the Bitcoin bottom requires looking at the behavior of long-term holders, as a true bottom is reached only when LTHs capitulate.
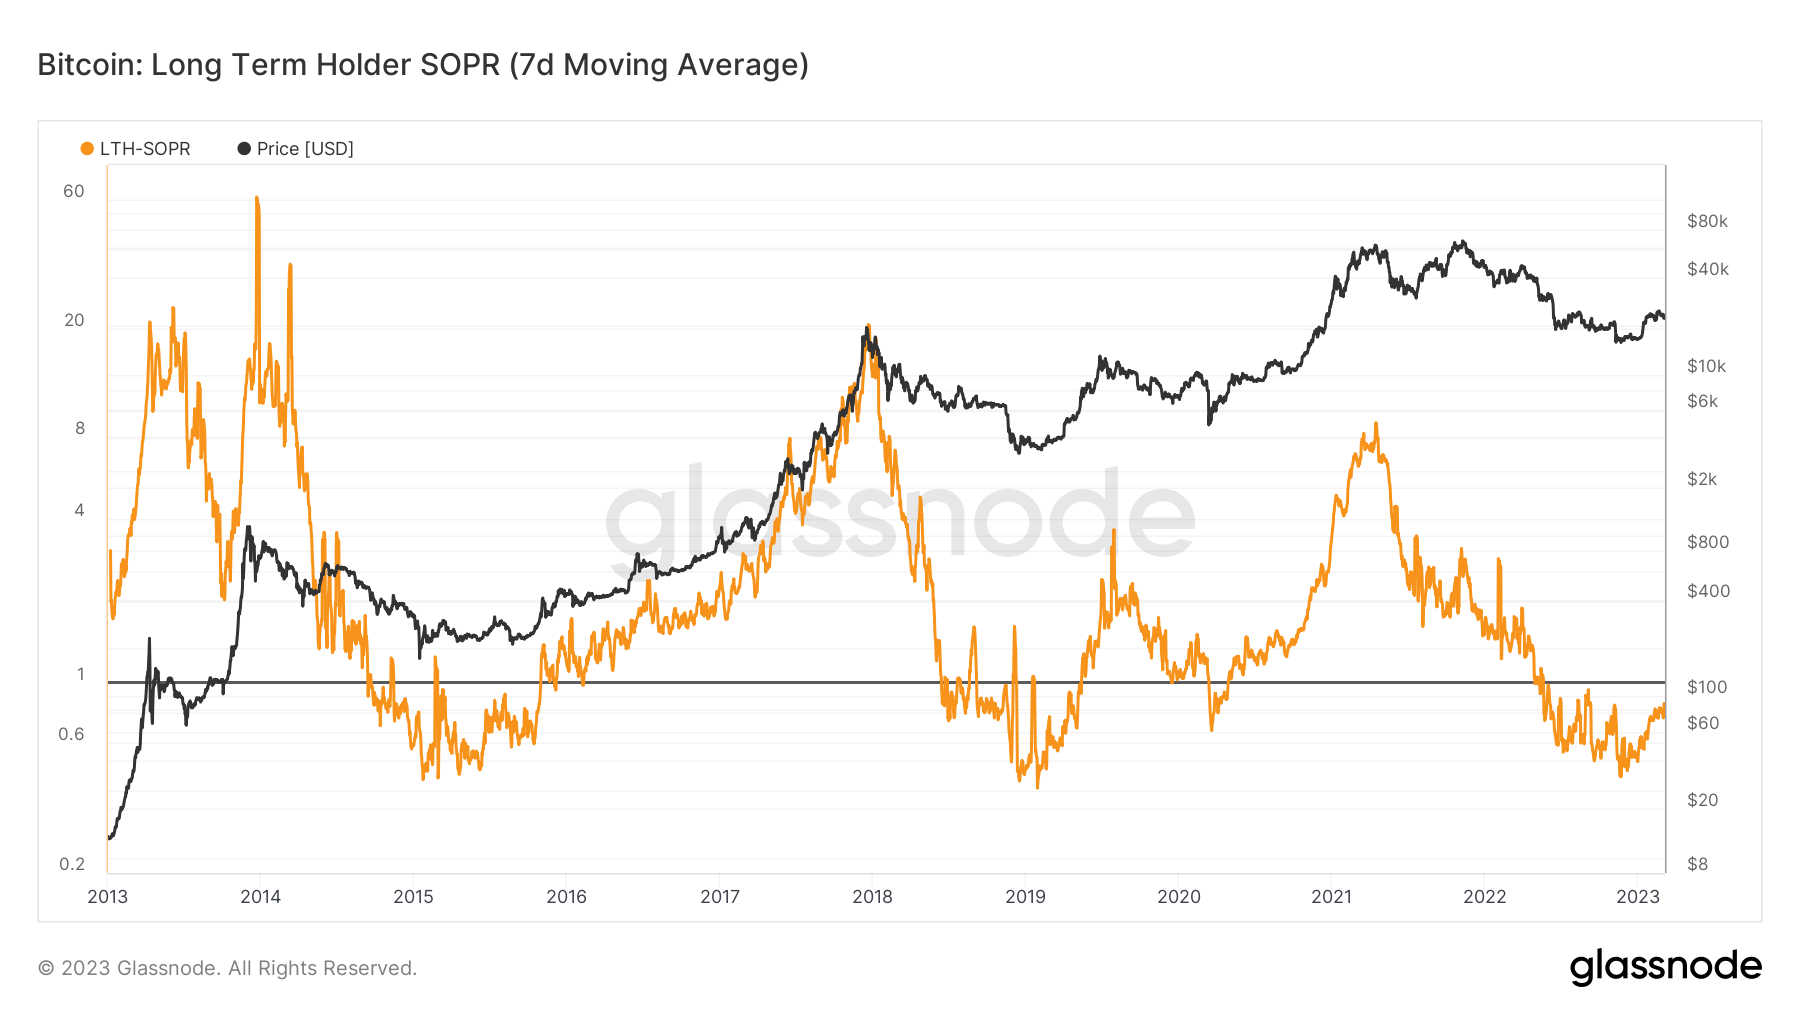
Spent Output Profit Ratio (LTH SOPR) is a metric that provides a clear insight into the behavior of Bitcoin holders. When applied to LTHs, it shows the degree of realized profit for all coins LTHs moved over a particular time frame.
A SOPR value greater than 1 implies that the coins were selling at a profit, while a SOPR value less than 1 shows the coins are selling at a loss. A SOPR trending higher shows profit is being realized, while a downward trending SOPR indicates losses.
Data analyzed by CryptoSlate showed that the LTH SOPR has been trending upward since the beginning of the year after bottoming to a three-year low in December 2022.

Unlike SOPR, which takes into account only spent outputs with a lifespan of more than 155 days, LTH MVRV takes into account only unspent outputs (UTXO).
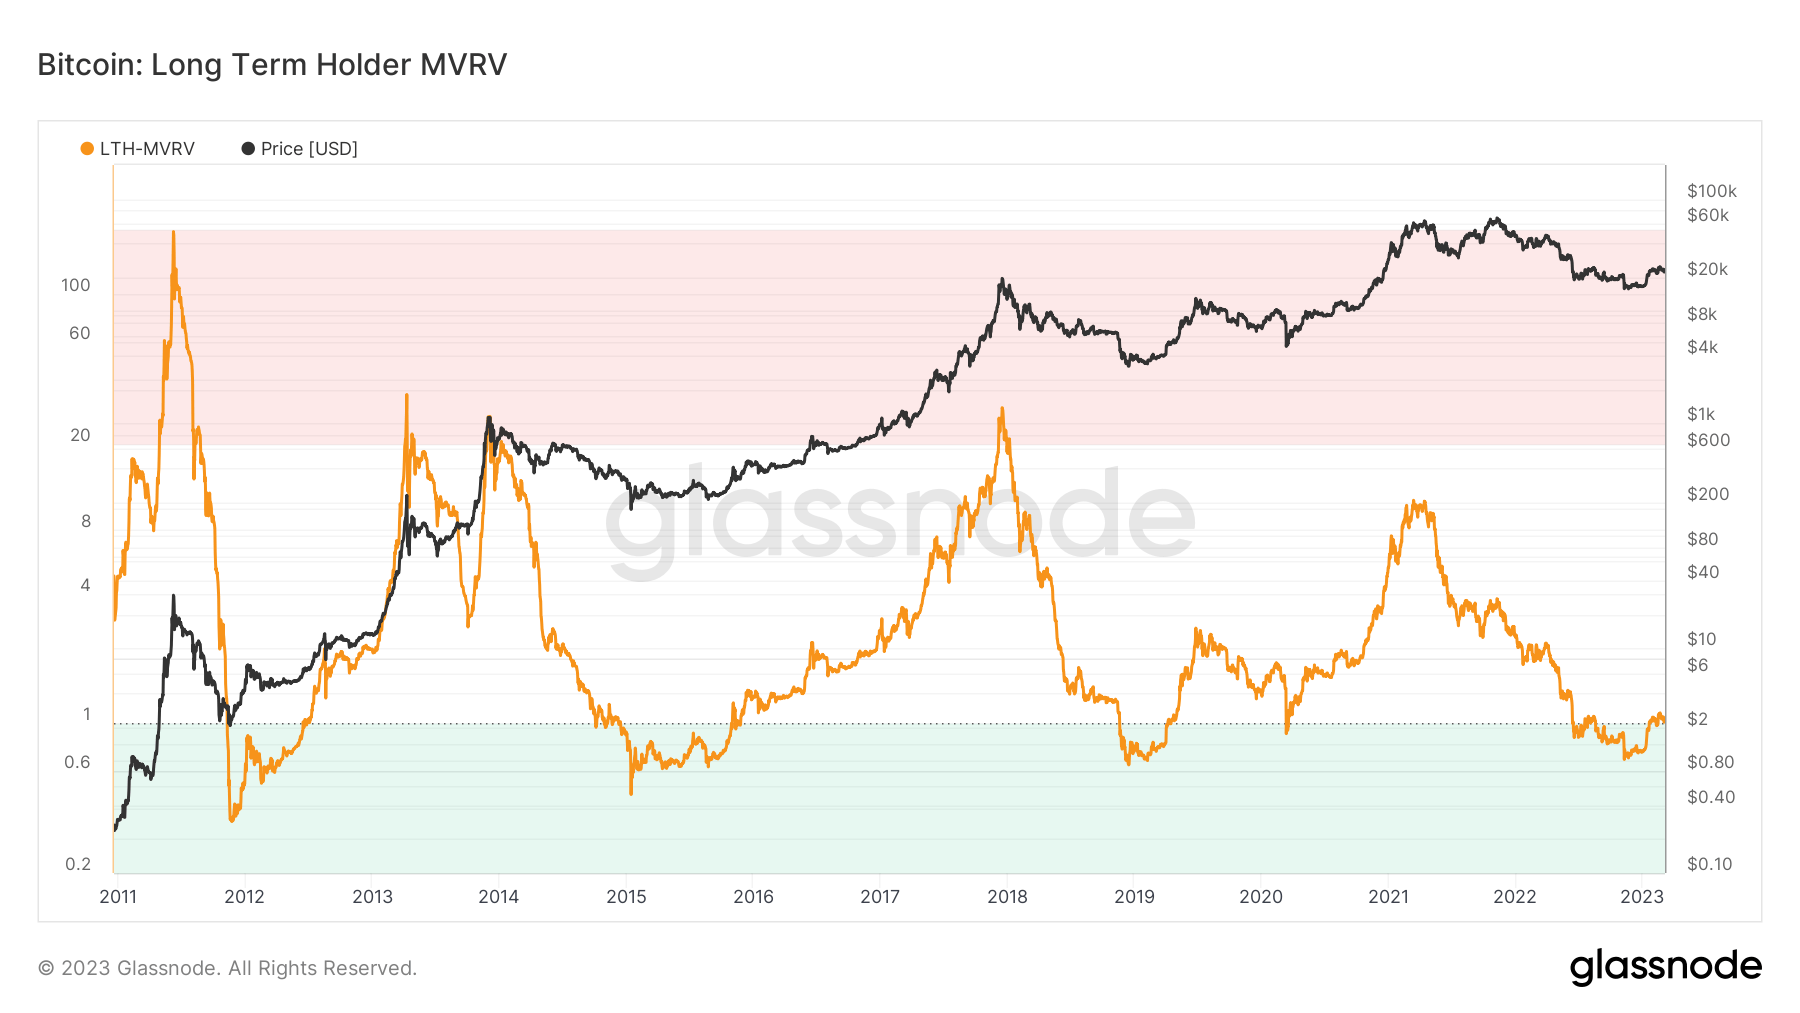
The MVRV ratio shows the ratio of Bitcoin’s market cap and its realized cap to determine whether it’s trading above or below fair value. Like SOPR, it provides a solid assessment of market profitability as extreme deviations between market value and realized value can be used to identify market tops and bottoms.
A rising MVRV ratio indicates a larger degree of unrealized profit and the potential for distribution as investors race to lock in profits. A decreasing or low MVRV shows a smaller degree of unrealized profits that could signal undervaluation and poor demand.
When the MVRV ratio drops below 1, a large portion of the supply is held either at break-even prices or at a loss. This is usually a sign of market capitulation and indicates that the bear accumulation phase might be coming to an end.
CryptoSlate analysis found that the LTH MVRV ratio has just broken above 1, indicating a potential end to the bear market.

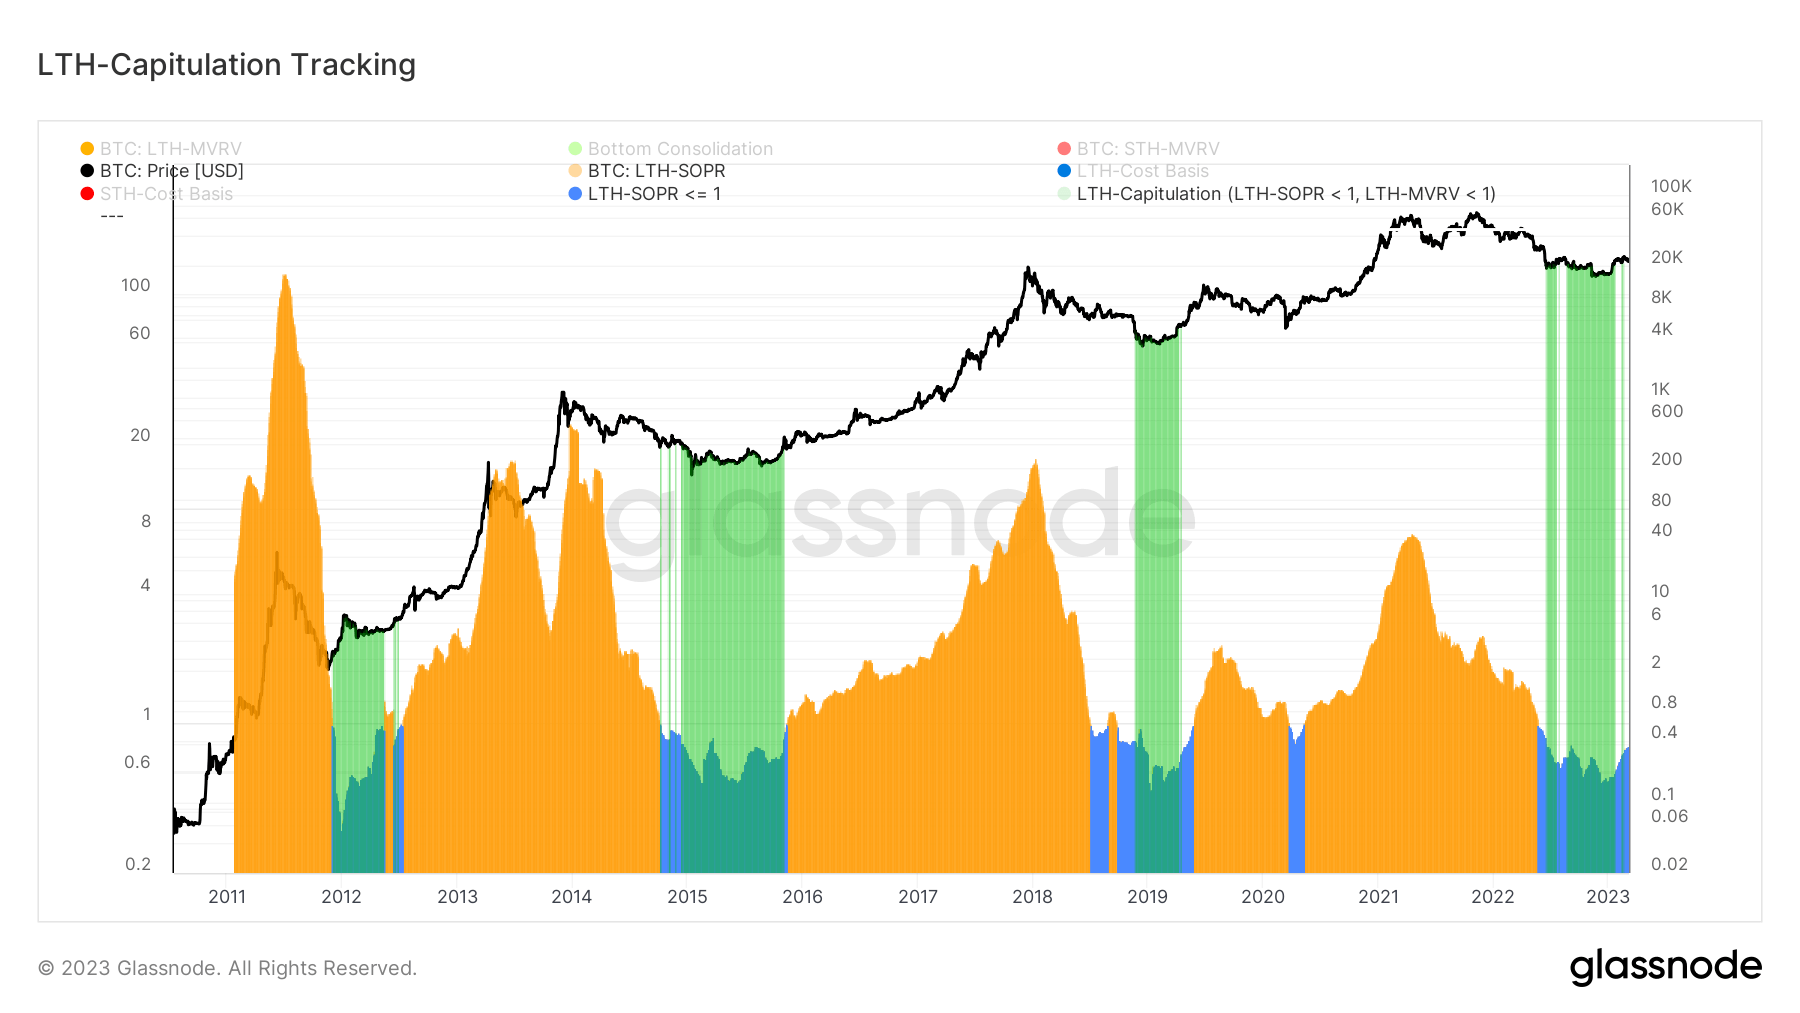
Compiling both SOPR and the MVRV ratio shows a somewhat hesitant end to the bear market.
Green highlights on the graph below show periods when both the LTH SOPR and the LTH MVRV ratios trended at or below 1. When the two ratios drop below 1, it shows market capitulation as both spent coins are being sold at a loss and a large portion of the circulating supply is being held at an unrealized loss.

CryptoSlate analysis confirms that the market is firmly out of capitulation. However, as the LTH SOPR is still trending at just under 1, the market still lacks the confidence to enter into a full-blown rally.


