Explore CryptoSlate’s Institutional Playbook, a 3-part guide series on exchange due diligence, crypto-as-a-service, and token listing strategy for institutional teams.
Explore CryptoSlate’s Institutional Playbook, a 3-part guide series on exchange due diligence, crypto-as-a-service, and token listing strategy for institutional teams.
The cryptocurrency market appears to have started the week on a positive posture as the top cryptos by market cap are already posting significant gains. Now, some of the most prominent technical analysts in the industry have laid out their perspectives about Bitcoin, Ethereum, and XRP. The following technical analysis evaluates what these chartist have to say.
Bitcoin’s uptrend remains intact
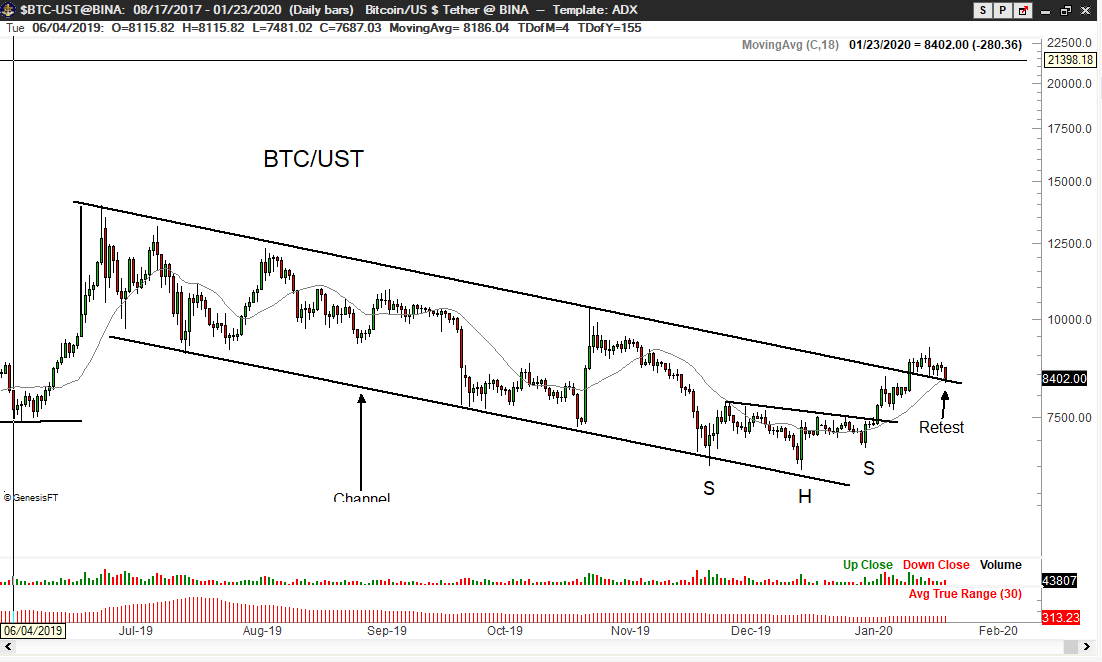
In a recent tweet, 45-year trading veteran Peter Brandt pointed out that there are many reasons to believe that the uptrend Bitcoin entered since the beginning of the year could continue unfolding.
Despite the 10 percent plunge that the flagship cryptocurrency suffered recently, Brandt maintains that there is a significant level of support around $8,400. This price hurdle is defined by the upper boundary of a descending parallel channel, the 18-day moving average, and the 3-day trailing stop rule, according to the analyst.
If this support level fails to contain the price of BTC, then Brandt expects that a “more serious correction” could take place.
The moving averages on BTC’s 1-day chart tell a similar story. Bitcoin is sitting at a pivotal point as it continues to trade within the 200 and 150-day moving averages. The pioneer cryptocurrency has been contained within this trading range since Jan. 13. As a result, it can be considered that a daily candlestick close above or below this area could likely determine where it is heading next.
On the upside, a spike in demand could take Bitcoin to break above the 200-day moving average. Turning this significant resistance level into support could be one of the strongest signals that BTC is about to enter a major bull rally.
Conversely, if the selling pressure increases and BTC breaks below the 150-day moving average it could try to test the next level of support provided by the 50-day moving average. This price barrier sits at $7,750.
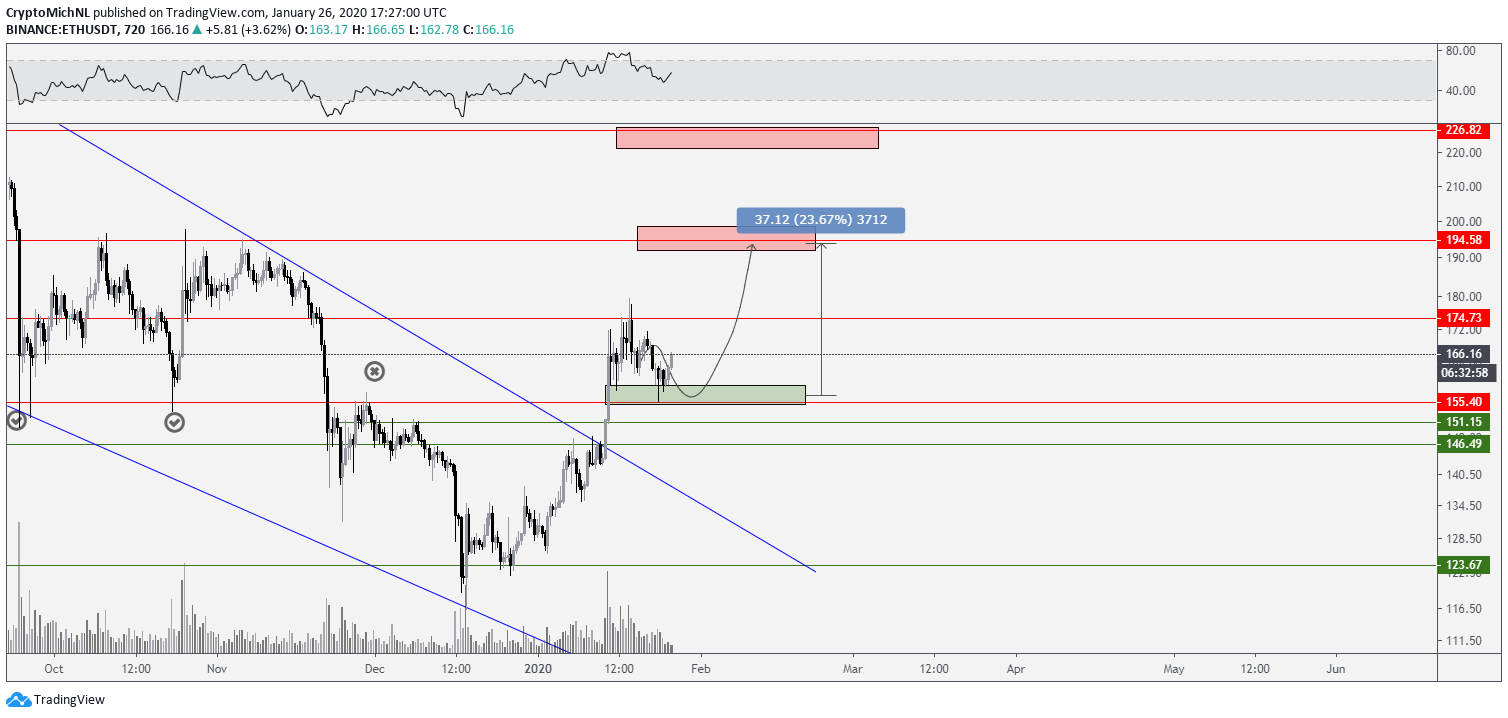
Michaël van de Poppe, a full time trader based in Amsterdam, believes that an “interesting week” is coming up for Ethereum. According to the chartist, Ether is looking “way better” than Bitcoin due to the recent support and resistance flip.
The fact that ETH was able to bounce off the $155 support level strongly, leads Poppe to believe that it could now be heading to the next level of resistance that sits around $194.60.
Such an optimistic scenario, as the one presented by Poppe, seems extremely possible. The recent correction took Ethereum down to test the middle Bollinger band. Since this support level was able to prevent ETH from dropping further, a rebound to the upper Bollinger band could be expected.
Additionally, the TD sequential indicator presented a buy signal the moment the current green two candlestick began trading above the preceding green one candle. This bullish formation could be estimating that the correction is over and now ETH is bound for another upswing. At the moment, the risk like sits at $194, which coincides with Poppe’s bullish target.
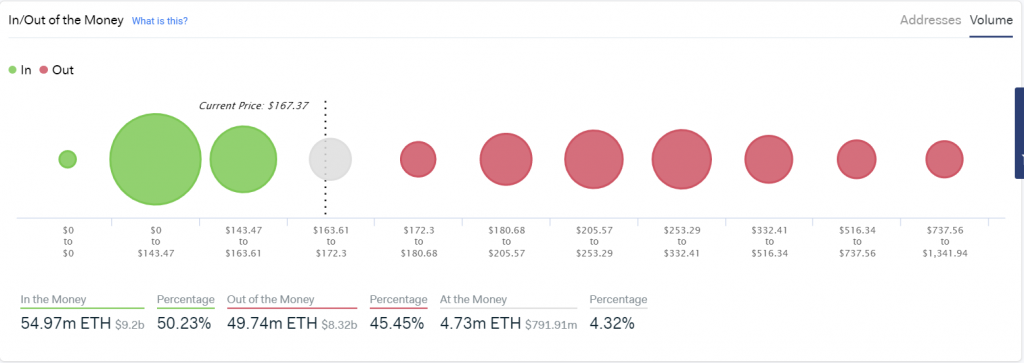
IntoTheBlock’s “In/Out Money” model estimates that if Ethereum indeed continues its uptrend, the next major point of resistance sits at approximately $190. This technical tool considers the distribution of Ether throughout individual wallets based on the current price.
CryptoSlate Daily Brief
Daily signals, zero noise.
Market-moving headlines and context delivered every morning in one tight read.
5-minute digest 100k+ readers
Free. No spam. Unsubscribe any time.
Whoops, looks like there was a problem. Please try again.
You’re subscribed. Welcome aboard.
Under this premise, there are 3.43 million addresses with balances between $180 and $205 containing 8.56 million ETH, which could serve as resistance. However, if the bullish impulse is strong enough to break through this barrier, the next significant level of resistance sits around $205 and $253. There are over 4 million addresses carrying nearly 11.7 million ETH around this price level.
On the downside, there is an important level of support between $143.50 and $163.60, since 2.7 million addresses are holding 16.81 million ETH.
In/Out Money Model by IntoTheBlock
XRP prepares for a massive move
CryptoBull maintains that XRP is preparing for a parabolic advance. The analyst explained that the moving average convergence divergence (MACD) is “printing the same sequence” as it usually does before this crypto enters a bull trend, based on the 1-week chart. Now, he is waiting for the 50 and 100-week moving averages to form a golden cross, which could serve as the last piece of information needed to confirm a potential rally.
Source: TradingView
Despite CryptoBull’s bullish outlook, the TD sequential indicator is currently presenting a sell signal on XRP’s 3-day chart. The bearish formation is a green nine candlestick that transitioned into a red one candle. This technical index estimates that a spike in sell orders could trigger a one to four candlestick correction or the beginning of a new bearish countdown.
Due to the ambiguity that XRP presents, the trading range between $0.218 and $0.245 is a reasonable no-trade zone. Breaking above or below this consolidation area could determine where XRP is heading next.
If the buying pressure behind this cryptocurrency increases allowing it to breakout of the no-trade zone in an upward direction, the next significant level of resistance to consider sits at $0.30. Nonetheless, an increase in the selling pressure behind XRP could take it to test the $0.20 support level.
Based on the point of view of the analysts mentioned above, it seems like the top three cryptocurrencies by market cap are about to resume their uptrend. If their respective support levels are able to hold, then they could be about to go through an interesting week as Michaël van de Poppe stated. Nevertheless, it remains to be seen whether a spike in volume would allow XRP to invalidate the bearish outlook presented by the TD sequential indicator allowing it to surge as it is expected for the rest of the market.