 Ethereum on-chain activity cools off during macro uncertainty
 Ethereum on-chain activity cools off during macro uncertainty
The drop in prices has calmed down a large part of the speculation that usually drives crypto markets and some of the on-chain activity has taken a dip.

Cover art/illustration via CryptoSlate. Image includes combined content which may include AI-generated content.
Investors’ concern of the impact of the Fed monetary policy decisions over the US financial markets has been affecting crypto markets as well during the last 2 months. Particularly, we’ve seen crypto prices broadly move closer to risk-on assets such as tech stocks. Correlations between both growth/tech stocks are currently high both for Bitcoin and Ethereum, but we have historically seen that Ethereum has been more correlated to growth/tech than Bitcoin.
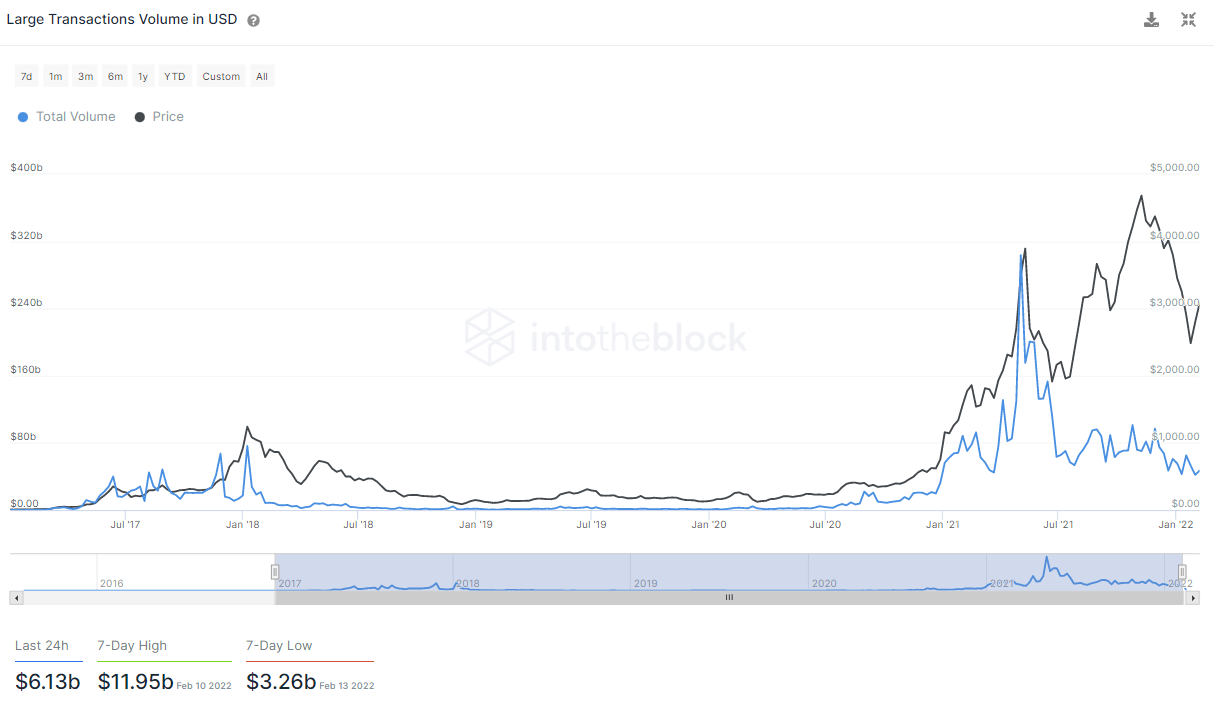
The drop in prices has calmed down a large part of the speculation that usually drives crypto markets and some of the on-chain activity has taken a dip as well. A large part of the trading volume is done by institutions and as can be seen in the next indicator by the large transactions volume. This week between $3 to $6 billion are traded daily on the Ethereum blockchain, while in the summer hype of last year an all-time high of $300bn was reached.

Large transactions are those considered where an amount greater than USD 100,000 was transferred. In this case, the Large Transactions Volume in USD indicator measures the aggregate dollar amount transferred in such transactions. So this drop in usage in trading volume might have been caused due to the current macro uncertainty.
The drop has also been notorious for the fees generated by the blockchain. These are useful to track the level of demand for transactions on the Ethereum blockchain. Since bull markets increase demand and speculation, average transaction fees tend to become more expensive during these periods. This indicator can be used as a proxy of sentiment and interest over the Ethereum blockchain.
After a substantial price increase, average transaction fees tend to increase even further as traders rush to take profits. As can be seen in the chart, now the average fee for a transaction is around $30, a 40% decrease since the all-time high of $50 seen in the 2021 Autumn.

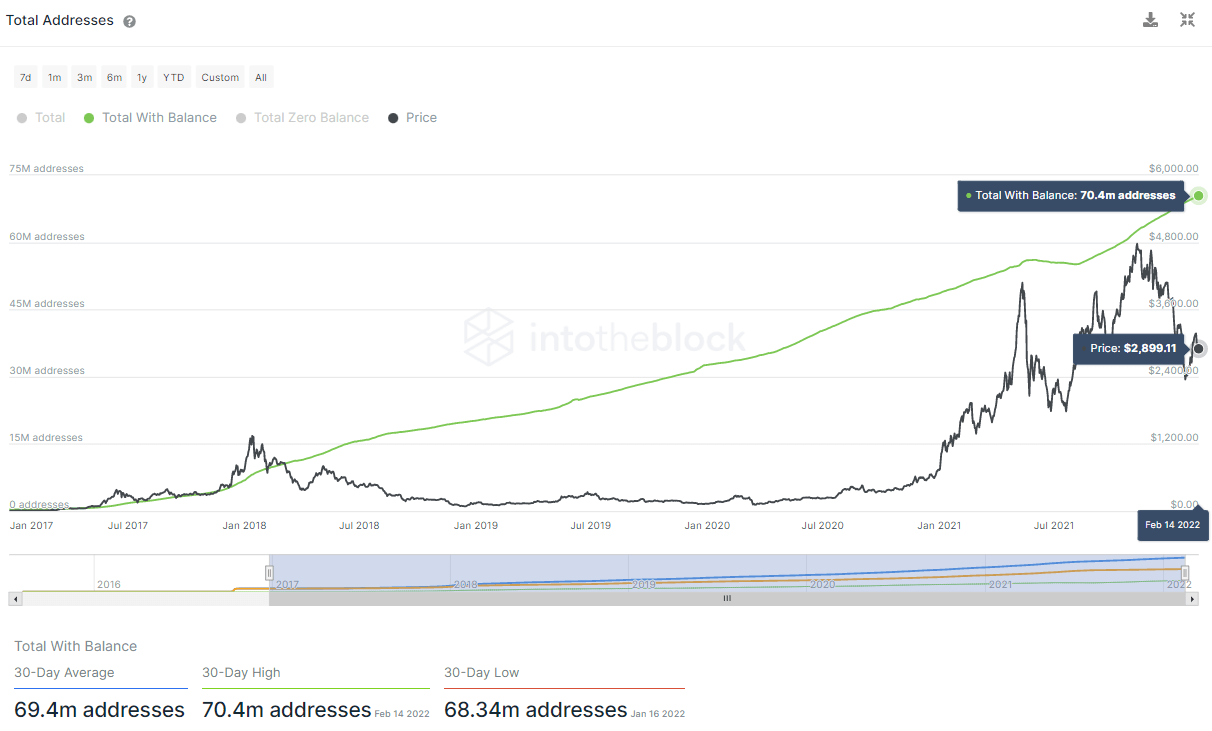
Regardless of the cooldown shown by these last two metrics, there is a key indicator that shows that in a long-term horizon the interest in holding and investing in Ethereum continues increasing, and that is the total number of addresses with balance. In general, an increase in the number of addresses with a balance is positive as it signals a more robust and growing user base.
While the total number of addresses with a balance does not exactly match the number of holders, it offers a valuable approximation to the number of people holding a crypto asset. There are cases where one user may have multiple addresses, but also scenarios where one address may hold multiple users’ funds (centralized exchanges).
As can be seen in the next chart, the total number of addresses with balances is now more than 70 million addresses. This is a metric that has not declined since the last summer and has been growing at a pace of roughly 10 million every three months since 2017.

Overall the usage of Ethereum can vary depending on the market conditions and speculation surges but it is key that the adoption of Ethereum continues growing every day as we have seen. We have seen continuously that users are interested in taking part in it just by holding Ethereum in their wallets or using the applications of decentralized finance that smart contracts blockchains enable. So far, this usage has continued despite uncertainty or bearish macro conditions.


