 Derivatives tell an interesting story of the recent Bitcoin price drop
 Derivatives tell an interesting story of the recent Bitcoin price drop

Cover art/illustration via CryptoSlate. Image includes combined content which may include AI-generated content.
Research by Jesus Rodriguez and Lucas Outumuro of IntoTheBlock
Derivatives are becoming an important element of the crypto markets. With more exchanges introducing products such as futures, perpetual swaps or options, the influence of derivatives in crypto markets has been increasing linearly. With the increase in derivative trading comes more data and with more data the opportunity of producing richer analytics that evaluates derivative products to extrapolate insights about the behavior of crypto assets.
From an analytical standpoint, derivatives are an incredible source of intelligence in capital markets and crypto is not an exception. For starters, derivatives are a clear indicator of the market sentiment in crypto assets as well as an accurate descriptor of behaviors such as hedging and speculation.
Additionally, derivatives are one of the elements that can contribute to the eventual rationality of crypto markets and become a key indicator for important aspects such as risk monitoring and portfolio management. In the current, still immature, state of the crypto markets, derivatives can have a disproportionate effect in price fluctuations which make it an even more interesting aspect to consider when studying crypto assets. If we look at this week’s movements in the Bitcoin price through the lens of derivative contracts, we can extrapolate some very interesting insights.
In the last seven days, Bitcoin has experienced a strong bearish momentum dropping over $10,000. The market behavior is attributed to macro-factors such as the impact of the coronavirus and its negative impact in global capital markets. However, crypto derivative contracts such as futures and perpetual swaps help paint a more complete narrative of the current market turmoil. Specifically, the indicators of volume, open interest, turnover ratio and basis are incredibly useful tools to comprehend Bitcoin’s recent price drop and what may follow.
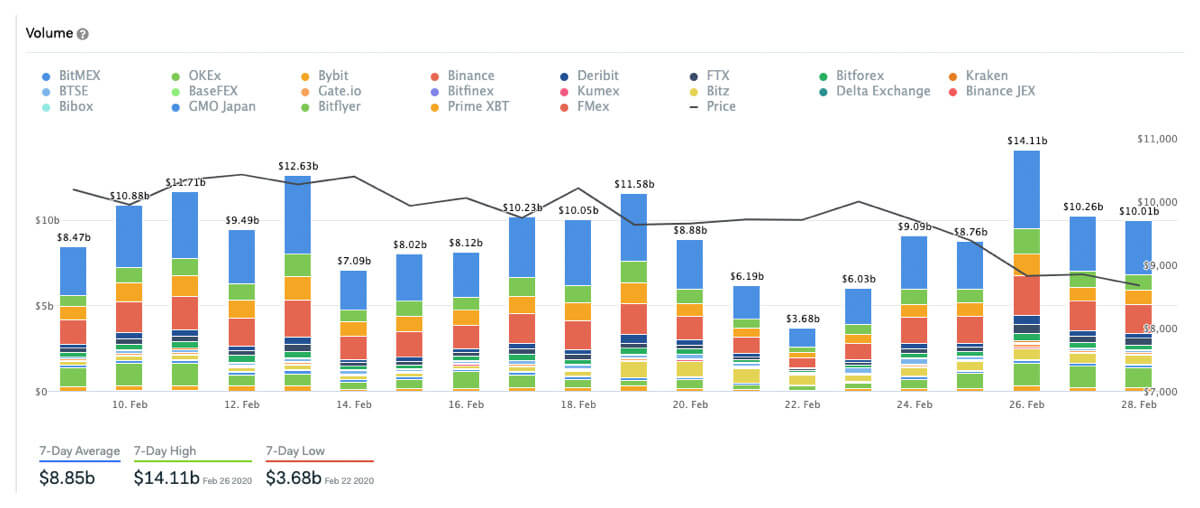
Perpetual swaps, which essentially function as futures contracts without an expiration date, have quickly been adopted as the crypto space go-to derivative contract. During the recent price drop, Bitcoin perpetual swaps volume reached a yearly high on February 26, surpassing $14 billion traded within 24 hours. Although this is a very large number, it is important to take into account that volumes are a function of leverage. With the option to select leverage of 100x (and sometimes even higher) in popular derivatives exchanges, perpetual swaps volumes have quickly surpassed spot volumes for several exchanges like Binance and Huobi.

While price and volume are the two main metrics of which indicators are derived for traditional technical analysis, derivatives trading introduces a third elemental factor: open interest. Open interest is the total amount of outstanding investor positions, usually measured as the dollar amount of open contracts in the case of cryptocurrency derivatives. In other words, open interest reflects the cumulative amount of open positions, regardless of the direction of the trades (includes both long and short data).
For example, let’s say a $100 million long contract is opened at a price of $10,000 with a liquidation price of $9,000 – at this moment both volume and open interest would increase by $100 million. (To clarify the liquidation price is the level at which a leveraged position is closed due to unrealized losses reaching the level of initial capital used to fund the position.) Let’s then say that the price reaches $9,000 – this effectively closes this position, therefore reducing open interest by $100 million, while volume still increases reaching a total of $200 million.
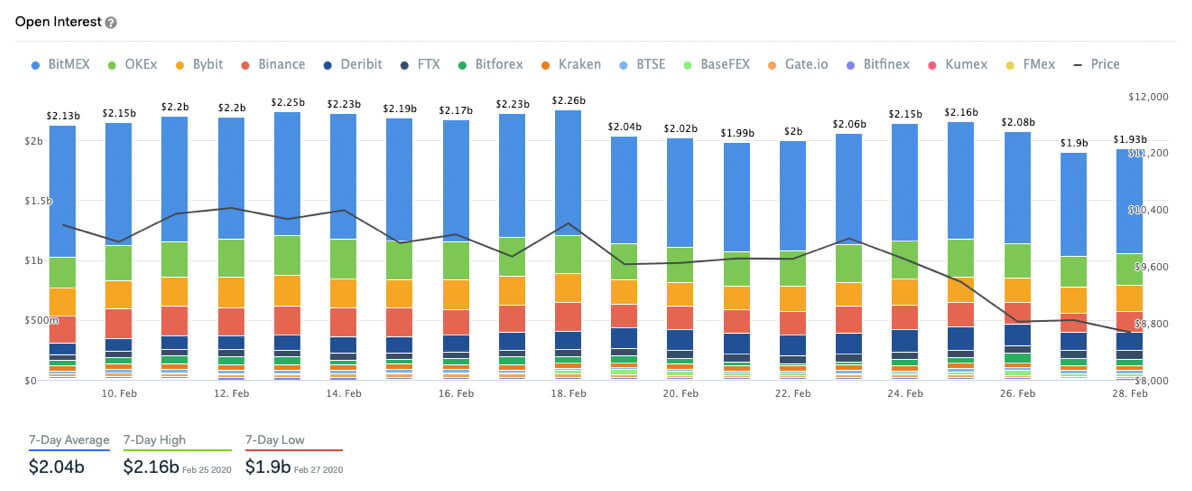
Open interest for perpetual swaps so far this year peaked on February 18 at $2.26B, right when Bitcoin registered a lower high. In the last week, open interest fell to a low of $1.9B on February 27 as prices dropped, indicating that several long positions were either closed or, perhaps more likely, liquidated. Additionally, we can see a spike in open interest in February 24 and 25 preceding the large price decline on February 26 hinting to an increase in the amount of investor short trades at that moment.
Afterward, though, open interest dropped 12 percent pointing to some of these positions being closed, a sign of weakening bearish momentum.

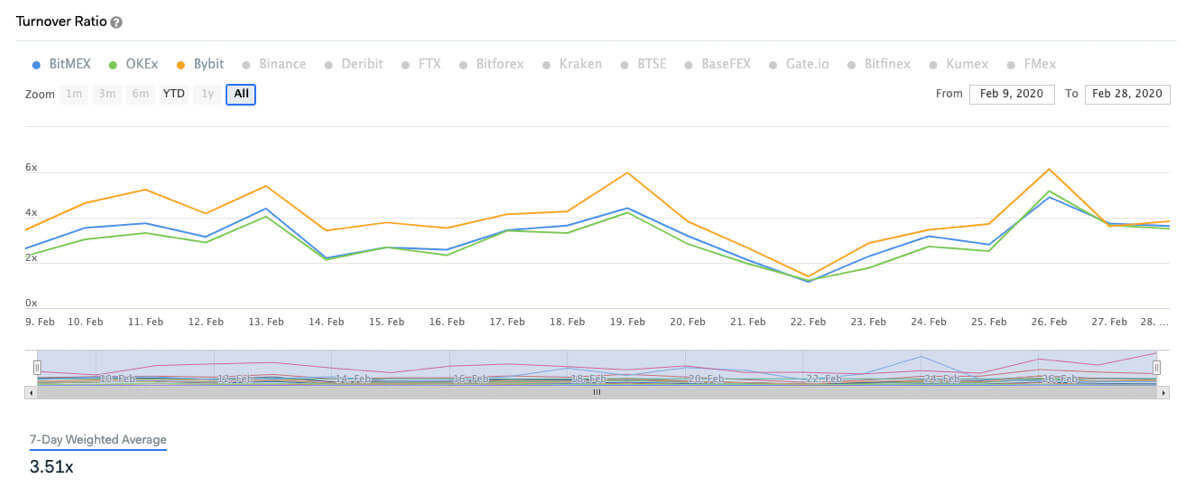
Another helpful metric introduced in derivatives trading is the turnover ratio, which is the 24-hour volume for a contract over its open interest. In a nutshell, this represents the ratio of short-term speculation and hedging in a contract relative to its longer-term open positions. As one may expect, the turnover ratio tends to increase in volatile days as traders intend to profit from quick price movements. While volatility attracts trading volume, it usually also leads to decreases in open interest as a significant amount of positions get liquidated. Because of these relationships, the turnover ratio provides interesting insights on the expectations and reactions derivatives traders have towards volatility
This pattern can be seen on two of the most volatile days in the recent Bitcoin retracement, February 19 and February 26. As Bitcoin dropped over $700 on February 26 from its high point to its low, turnover quickly spiked to a monthly high. While the turnover ratio varies across exchanges it does tend to move in tandem, averaging around 5x for top exchanges versus a weekly average of 3.51. Following this drop, the turnover ratio stabilized but at a slightly higher average level indicating that Bitcoin’s recent relative volatility may resume.

A natural complement to the turnover ratio is the basis indicator. While the turnover ratio can offer insights into volatility, the basis provides a better understanding of price movements. Basis is the premium (or discount) between the spot price and the futures contract price.
Over time, this premium or discount decreases as futures price converge towards spot prices approaching the expiration date. In traditional markets, this concept is often tied with the concepts of contango and backwardation. In essence, a futures contract is considered to be in contango when it’s priced at a premium relative to current prices and in backwardation when it’s at a discount. Since basis is the index price minus the futures price, premiums are shown as negative values for basis and discounts as positive.
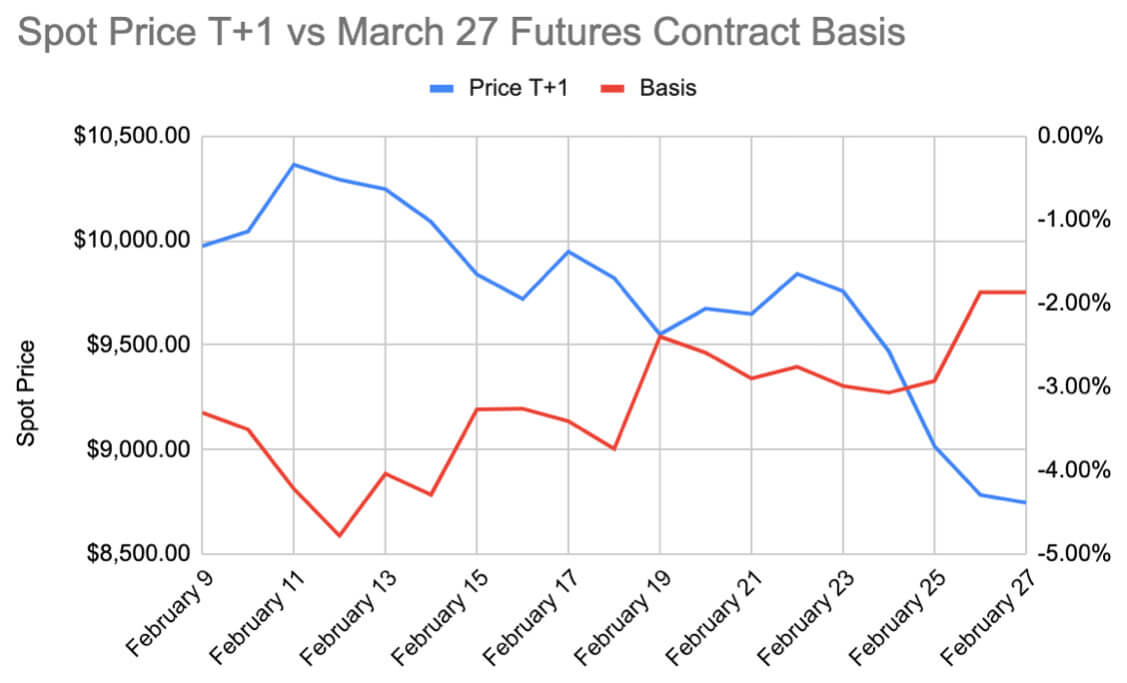
Going back to Bitcoin’s recent drop, basis increased significantly meaning that the premium decreased. However, futures contracts settling on March 27 still remain in contango, as seen in the graph below, which is a sign that expectations remain positive among derivatives traders.

While it may come as no surprise that the recent price decline is reflected on a decrease on the contract premium, it is worth noting out that the basis also appears to have a strong correlation with the price movement the day after. Throughout the month of February, the basis has had a remarkable 0.7 r-squared versus price movements on the following day, indicating the strong relationship between futures market activity and changes in spot prices.

Overall, these indicators demonstrate the prominence that derivatives markets are having in the crypto space. Analyzing the volume and open interest in the recent Bitcoin price drop point to the fact that several long positions got liquidated in the past few days, but is also showing a decrease in the bearish momentum. The subsequent spike in the turnover ratio demonstrates how derivatives traders looked for short-term hedging and speculating opportunities to take advantage of the recent volatility.
Lastly, changes in futures contracts’ premium, which can be seen in the basis, indicate how derivatives traders positioning end up reflecting in spot prices. Ultimately, these examples confirm the importance of derivatives indicators as effective complements to traditional technical analysis and blockchain-specific metrics.
About the authors
 Jesus Rodriguez is the CEO-CTO of IntoTheBlock, a market intelligence platform for crypto assets. He is a computer scientist, a speaker, and author on topics related to crypto and artificial intelligence.
 Lucas Outumuro is a Sr. Researcher at IntoTheBlock, a market intelligence platform for crypto assets. His areas of focus include crypto derivatives, DeFi and web 3.0 in general.
Bitcoin Market Data
At the time of press 1:18 am UTC on Apr. 6, 2020, Bitcoin is ranked #1 by market cap and the price is down 0.8% over the past 24 hours. Bitcoin has a market capitalization of $159 billion with a 24-hour trading volume of $44.59 billion. Learn more about Bitcoin ›
Crypto Market Summary
At the time of press 1:18 am UTC on Apr. 6, 2020, the total crypto market is valued at at $248.45 billion with a 24-hour volume of $159.73 billion. Bitcoin dominance is currently at 63.92%. Learn more about the crypto market ›


