 Data from IntoTheBlock reveals that Bitcoin sits at a make-or-break point
 Data from IntoTheBlock reveals that Bitcoin sits at a make-or-break point

Cover art/illustration via CryptoSlate. Image includes combined content which may include AI-generated content.
Bitcoin sits at a pivotal point facing strong support and resistance ahead of it, according to data from IntoTheBlock. Moving below or above this zone could be the catalyst for the next major price movement.
Bitcoin’s coming decisive price movement
Over the past 30 hours, Bitcoin took a nosedive after hitting the $10,300 resistance level. Its price plunged nearly 10% to hit a low of $9,300. Following the $1,000 movement, the flagship cryptocurrency is now mostly consolidating within a narrow $120 range defined by the $9,530 support level and the $9,650 resistance level.
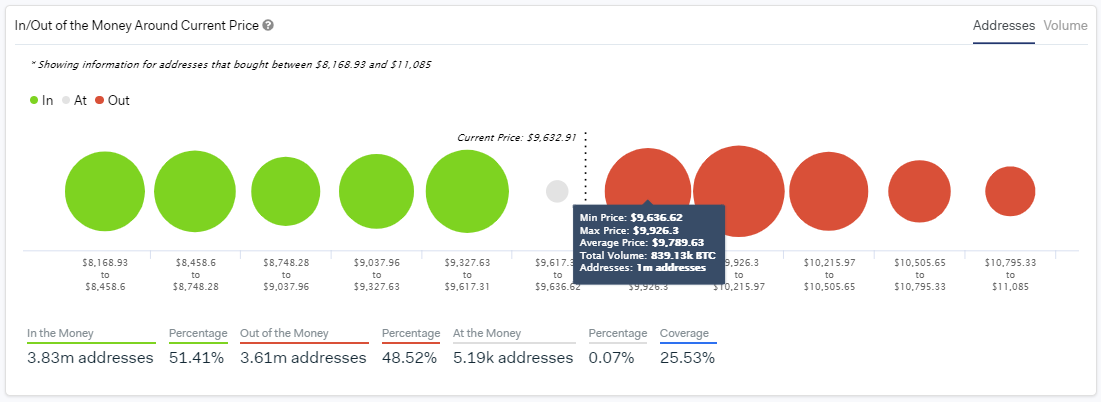
According to IntoTheBlock, a machine learning and statistics modeling firm, this trading range is key to Bitcoin’s trend. Based on the firm’s “In-Out of the Money Around Current Price” (IOMAP) model, there are nearly 900,000 addresses collectively holding over 732,000 BTC at approximately $9,440.
This area represents a significant support level that is preventing the pioneer cryptocurrency from a further decline.

The IOMAP also reveals on the upside there is a similar amount of tokens held that are currently rejecting the price of Bitcoin from continuing its uptrend.
IntoTheBlock said:
“A look at the IOMAP model for Bitcoin shows 1 [million] addresses with positions [between $9,636 and $9,926]. This could be seen as the level of resistance for BTC to get to $10,000 as a percentage of investors that previously bought at this price may be looking to break-even.”

Due to the high levels of support and resistance that Bitcoin is currently facing, a look at its price chart could help determine where it is heading next.
A reversal pattern appears to be forming
A head-and-shoulders pattern seems to be developing on BTC’s 4-hour chart. This technical formation is considered to be one of the most reliable trend reversal patterns.
Bitcoin is currently being held by its 200-four-hour moving average within the same time frame. This is also where the neckline of the head-and-shoulders pattern sits.
An increase in the selling pressure behind the pioneer cryptocurrency that allows it to break below this significant support cluster could ignite a sell-off. BTC could then plummet over 9 percent to hit a target of $8,500.
This target is determined by measuring the distance between the head and the neckline and adding that distance down from the breakout point.
Nevertheless, a spike in demand for Bitcoin that allows it to close above the height of the right shoulder at $10,300 could invalidate the head-and-shoulders pattern. The upswing would likely be followed by an increase in buy orders that takes BTC to new yearly highs. On its way up, the next significant resistance levels sit between $11,500 and $13,000.
Time will tell whether support or resistance will break first giving more clarity about where Bitcoin is heading next.
Bitcoin Market Data
At the time of press 6:06 pm UTC on Feb. 20, 2020, Bitcoin is ranked #1 by market cap and the price is down 6.42% over the past 24 hours. Bitcoin has a market capitalization of $173.33 billion with a 24-hour trading volume of $49.41 billion. Learn more about Bitcoin ›
Crypto Market Summary
At the time of press 6:06 pm UTC on Feb. 20, 2020, the total crypto market is valued at at $274.92 billion with a 24-hour volume of $184.69 billion. Bitcoin dominance is currently at 63.09%. Learn more about the crypto market ›


