 Chainlink daily transfers rocket by 40% — what on-chain metrics are saying
 Chainlink daily transfers rocket by 40% — what on-chain metrics are saying

Cover art/illustration via CryptoSlate. Image includes combined content which may include AI-generated content.
The entire crypto market has been able to incur some notable upwards momentum today, and Chainlink appears to be leading the charge.
Its ongoing upswing comes after a long-held bout of sideways trading and has allowed it to begin ascending up towards its previously established all-time highs.
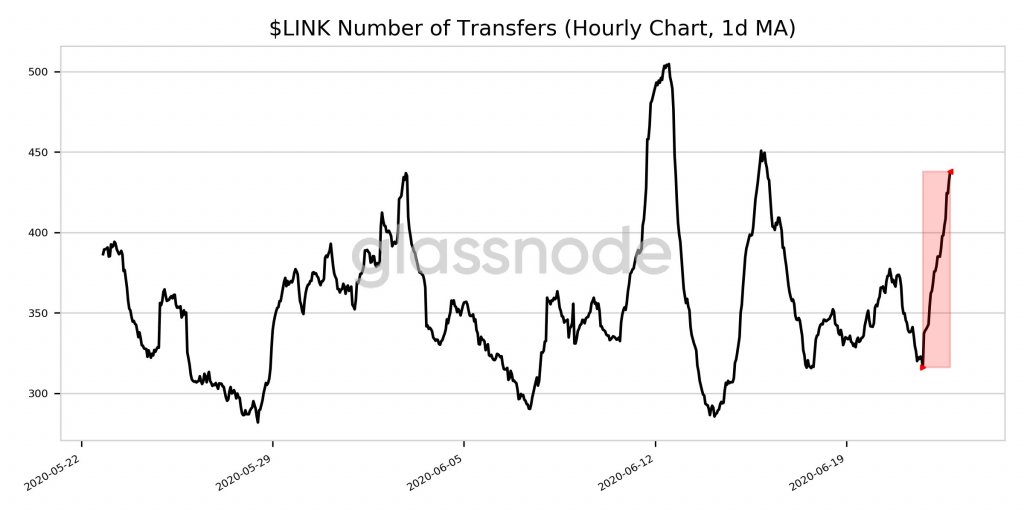
This newfound momentum is not unwarranted either, as the token has seen a massive spike in the number of transfers taking place over the past 24 hours. This seems to point towards a rise in organic trading volume.
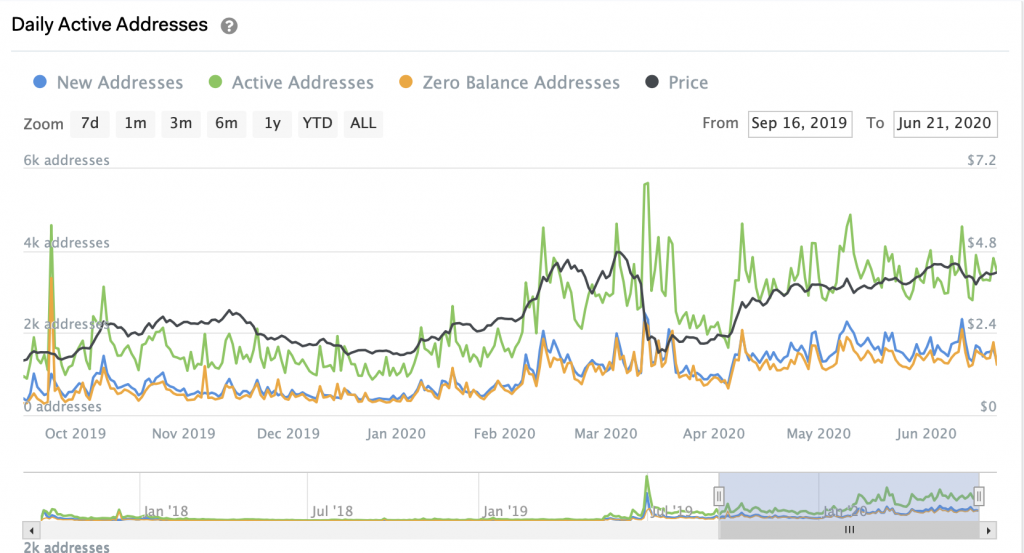
Other on-chain metrics that provide insight into the cryptocurrency’s fundamental strength are flashing positive signs as well. One such metric would be the growth seen while looking towards the number of active LINK wallet addresses over the past few months.
Chainlink sees sudden surge in daily transfers, pointing to rise in organic trading volume
Chainlink has led the market’s upswing today, with its 24-hour gains only being rivaled by those seen by Ethereum.
At the time of writing, LINK is trading up just under six percent at its current price of $4.41. The token is only trading down roughly ten percent from its previously established all-time highs, and it is possible that buyers will soon target these levels.
It is important to note that the ongoing upswing is being driven by overt fundamental strength.
One metric indicating this is a sharp rise seen while looking towards the number of LINK transfers that have taken place over the past 24-hours.
According to data from analytics platform Glassnode, this metric has increased by 40 percent over the past 24-hours.
“LINK Number of Transfers (1d MA) increased significantly in the last 24 hours. Current value is 437.792 (up 38.5% from 316.042).”

This indicates that strong organic trading volume is driving this movement.
LINK daily active address count caught within strong mid-term uptrend
Another metric signaling that Chainlink’s bullish price action is warranted is the mid-term uptrend its daily active address count has been caught within.
Data from blockchain visualization tool IntoTheBlock reveals this, showing that the cryptocurrency’s active address count has climbed from yearly lows of roughly 1,000 to nearly 4,000 currently.

This growth, coupled with the ongoing rise in transactional volume, seems to point towards a major escalation in trading activity amongst its investors.
The next heavy resistance region that investors should closely watch sits between $4.80 and $5.00, which is where it set its all-time highs earlier this year.
Whether or not its current fundamental strength is enough to thwart a selloff at this level will be telling as to the state of its macro-uptrend.


