 Asset manager: This key indicator means the Bitcoin bottom is in
 Asset manager: This key indicator means the Bitcoin bottom is in

Cover art/illustration via CryptoSlate. Image includes combined content which may include AI-generated content.
Over the past few days, Bitcoin (BTC) has started to show signs of life, surging as high as $7,700 on the morning of Dec. 23. As of the time of writing this, the cryptocurrency is changing hands for $7,300, up nearly 15 percent from the brutal $6,400 low put in last week.
While bears argue that it is too soon to tell that the bottom of the downtrend is in, a key signal that last appeared after Bitcoin hit $3,150 in December of last year has just made an appearance again, providing investors with a strong bull case moving into 2020.
The bottom is in, key indicator says
If you’ve been on Crypto Twitter in the past few months, you’ve likely heard the term “miner capitulation” used time and time again.
For those unaware, miner capitulation is when certain miners of the Bitcoin network or other blockchains, often retail and non-industrial operations, are losing money by continuing to contribute computational power to collect cryptocurrencies. These miners are forced to sell their mined cryptocurrencies and/or shut off their operations, resulting in a large amount of bearish pressure in the Bitcoin market.
There is no exact way to determine when such capitulation takes place, though analysts say it coincides with stagnations or decreases in the Bitcoin network’s hash rate.
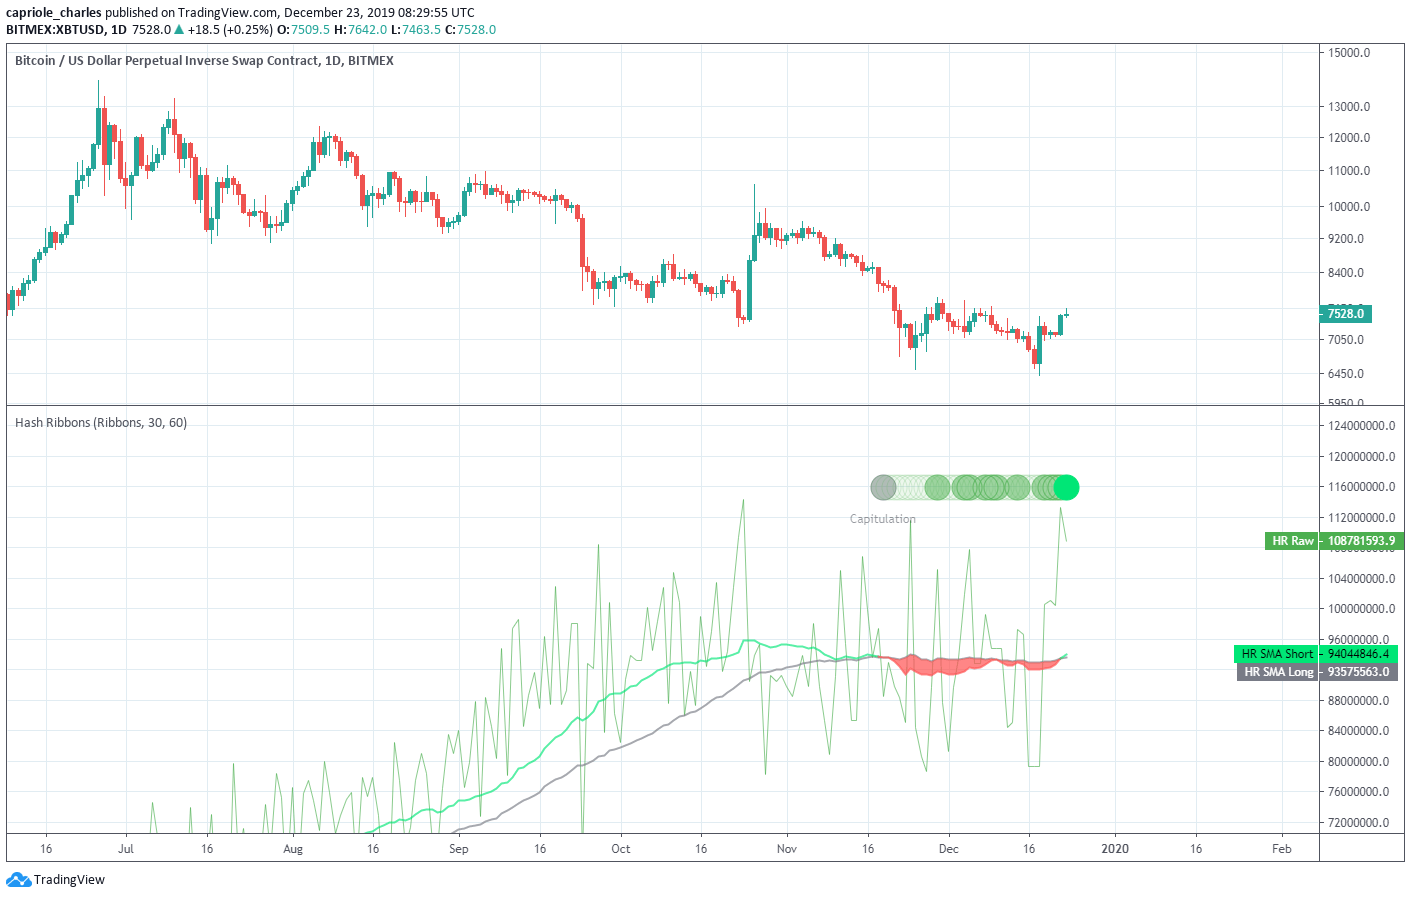
Charles Edwards, a digital asset manager, remarked that the most recent capitulation began on Nov. 19, with hash rate stalling and Bitcoin falling by 25 percent in the weeks that followed.
But according to his latest update, posted Dec. 23, miner capitulation has most likely ended, with Bitcoin’s hash rate finally breaking higher after weeks of flatlining, resulting in a signal of “recovery” being printed by his “Hash Ribbons” indicator. Edwards said:
“We have Hash Rate recovery! Historically this has signaled the end of Miner Capitulations.
In this case, it was a very shallow capitulation of average length (34 days). Buying on positive momentum from here has historically had wonderful R:R (likely at least a few days away)”

This is notable: the last time the Hash Ribbons printed a recovery signal was in January this year, which was when BTC was attempting to hold the low-$3,000s after the brutal plunge from $6,000 to $3,150. Also, a signal of recovery from the Hash Ribbons marked at least two other macro price bottoms in Bitcoin’s history.
As reported by CryptoSlate previously, a capitulation in the mining population and subsequent recovery is what preceded every previous bull run in Bitcoin’s history.
Simple chart analysis agrees
It isn’t only the Hash Ribbons that indicate the bottom is this macro move is in.
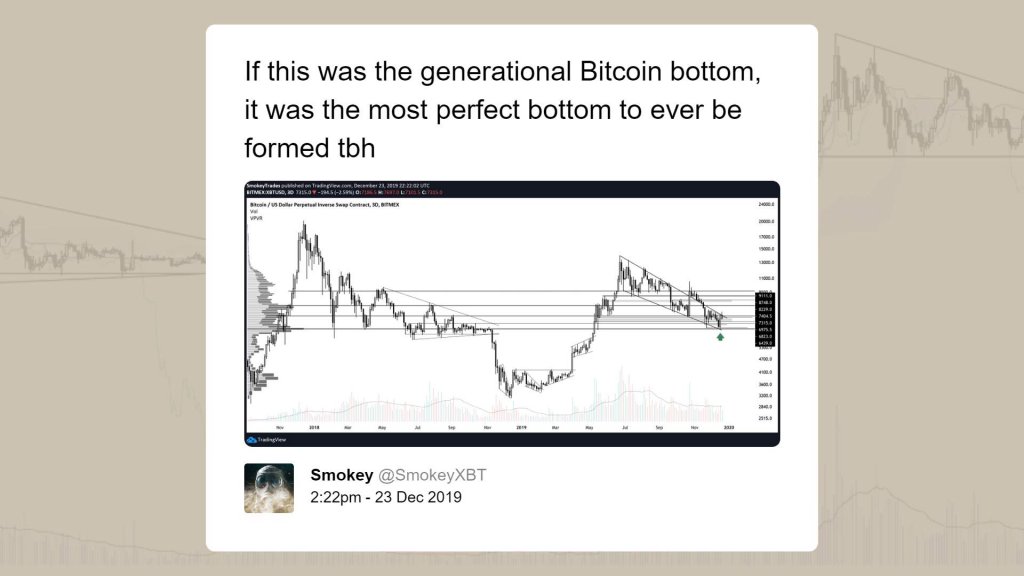
Prominent trader “SmokeyXBT” recently posted the chart below on Twitter, remarking that if $6,400 “was the generational Bitcoin bottom, it was the most perfect bottom to ever be formed.”
Indeed, the chart he attached to this message shows that BTC bounced off a macro established support of the 2018 bear market, which coincided with the lower bound of a six-month-long descending channel.

Can bulls push Bitcoin higher from here?
The question then remains: can bulls push Bitcoin higher from the $7,000s to the $8,000s and beyond?
According to a number of prominent traders, for sure.
“Dave the Wave,” a prominent chartist that called the recent drop to the $6,000s when Bitcoin was trading above $10,000, recently noted that he believes the one-week Moving Average Convergence Divergence (MACD) — an indicator tracking trends of assets — is likely going to see a bullish crossover early next year. The popular trader wrote:
“Weekly MACD shaping up to re-cross bullishly soon to confirm the continuation of the next cycle.”
Bullish MACD readings on Bitcoin’s one-week chart marked the start of previous bull runs, including the miniaturized one seen from March of this year to July.
Fundamental developments seemingly favor bulls as well. As put best by Andy Bromberg of Coinlist in a recent Bloomberg interview:
“We are seeing a level of building that has happened in 2019 [which makes it feel like] we’re in the moment of everyone is putting on their jumpsuits, ready to take off.”


