Analysts weigh in on Bitcoin’s price action to determine whether the bottom is in

Cover art/illustration via CryptoSlate. Image includes combined content which may include the use of AI tools.
Bitcoin’s price action throughout 2020 can be described as “wild.” The pioneer cryptocurrency rose to $10,500 and fell over 62 percent since February amid fears of the widespread transmission of coronavirus. Now, some of the most prominent analysts in the industry weigh in on where BTC could be headed next.
Bitcoin takes a massive nosedive
Bitcoin saw its price crash by 50 percent over the last two days after the coronavirus outbreak was labelled a global pandemic by the World Health Organization (WHO). The flagship cryptocurrency went from trading at a high of $8,000 to recently hit a low of $4,000.
The sell-off sent more than half the circulating Bitcoin supply—approximately 9.8 million BTC—into loss, according to Glassnode. The blockchain data and intelligence provider firm maintains that this is the first time in over a year that the percent of BTC supply in profit is less than 50 percent.
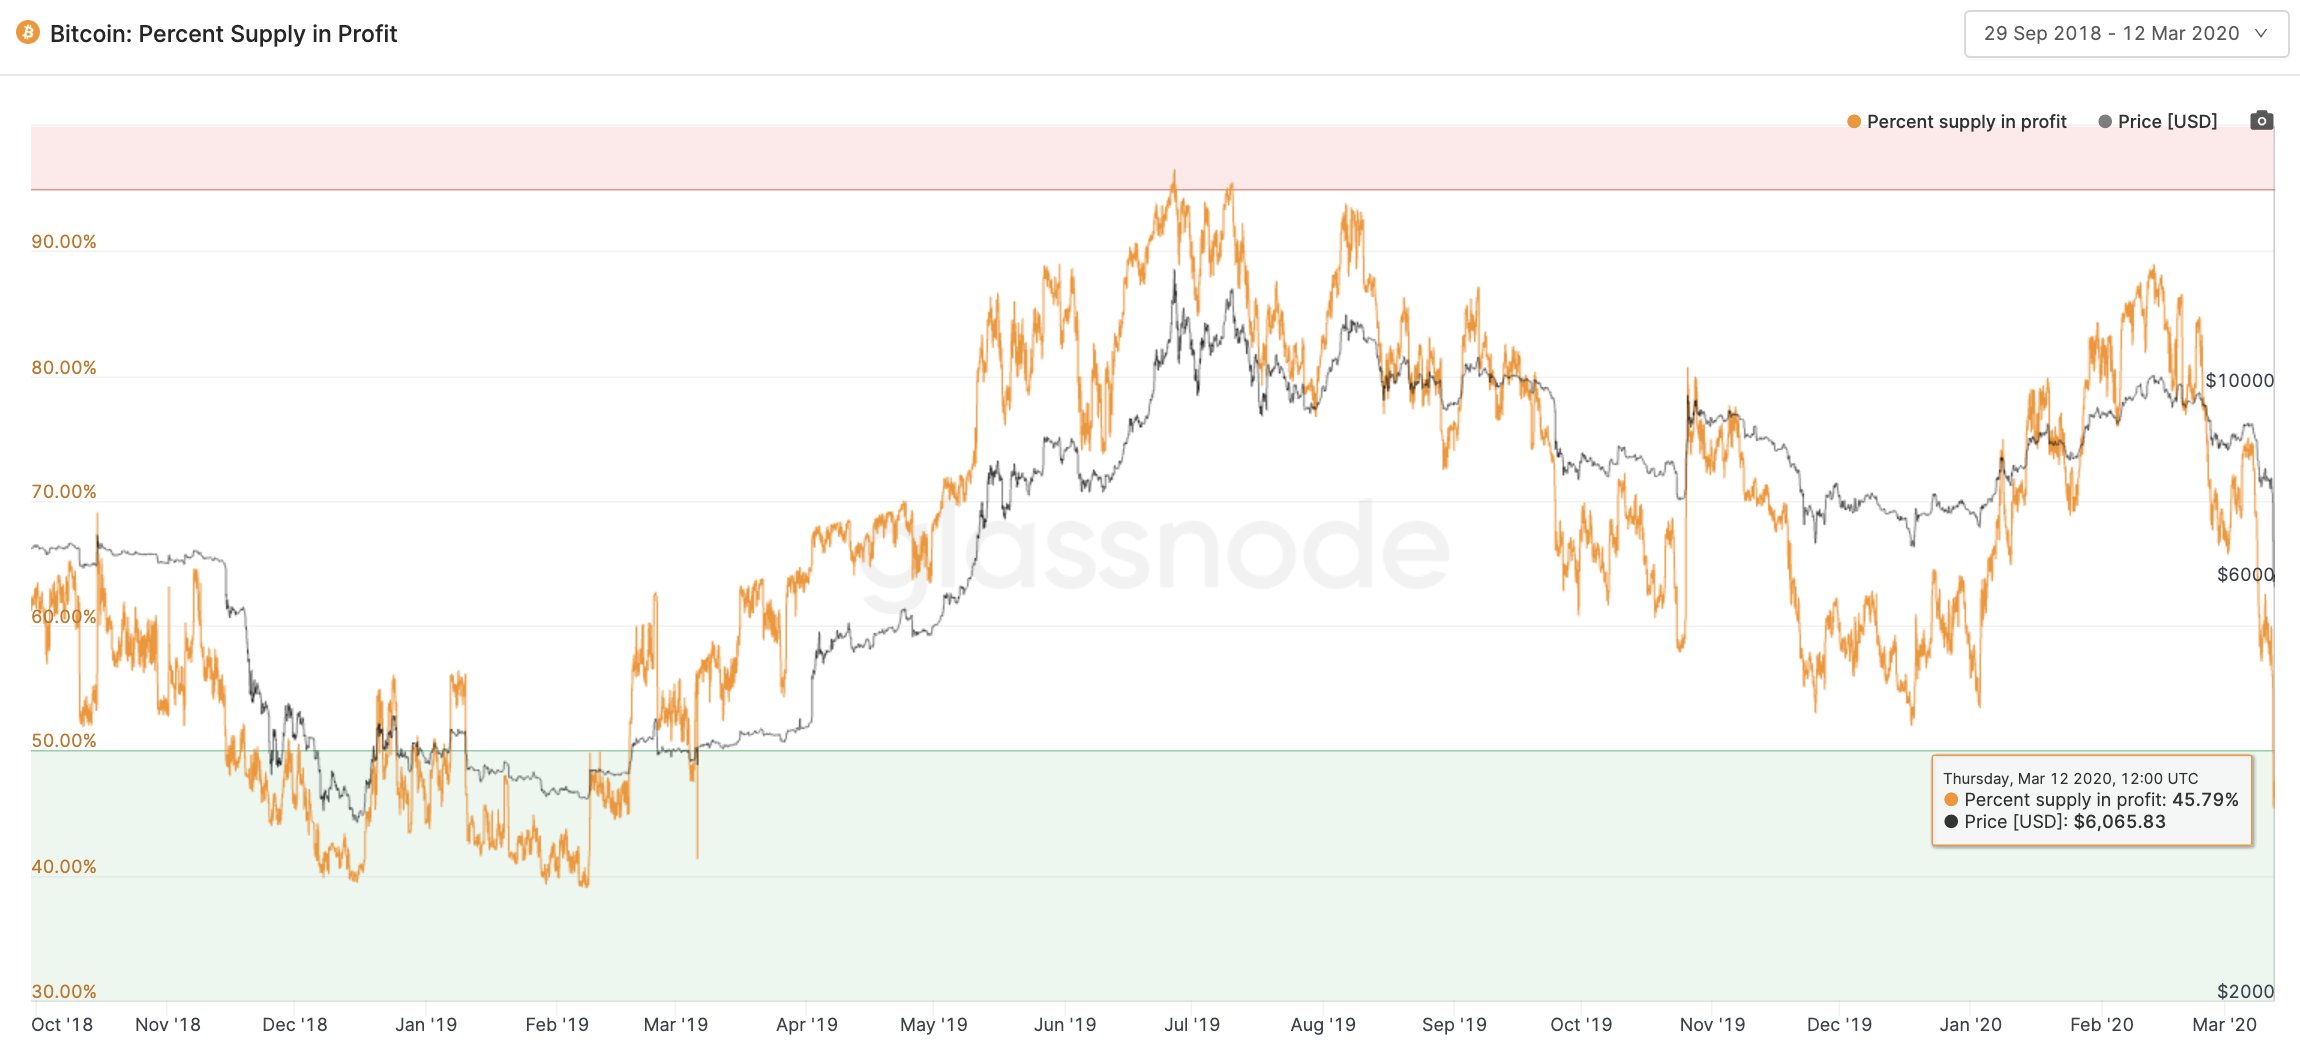
The significant number of investors that went into losses during the recent downturn appears to have triggered extreme levels of fears across the entire market, based on the Crypto Fear and Greed Index. This fundamental indicator reached a value of 10 (extreme fear).
Predicting the future through chart patterns
Although most market participants expected the run up to the Bitcoin halving to be bullish, 45-years trading veteran Peter Brandt seems to have predicted the recent crash in early December 2019.
At the time, Brandt explained that Bitcoin’s price action is characterized by a series of parabolic movements since 2011. Every time a parabola is “broken or violated,” the market tends to decline for at least 12-months from high to low. These violations result in 80 percent corrections measured from the peak to the bottom.
Under this premise, the author of Diary of a Professional Commodity Trader forecasted that the violation of BTC’s fourth parabola, which took place around July 2019 following the peak at $14,000, could lead to a drop below $5,000. Such a bearish impulse would represent the 80 percent correction needed for Bitcoin to resume its “historic bull trend,” according to the trading veteran.
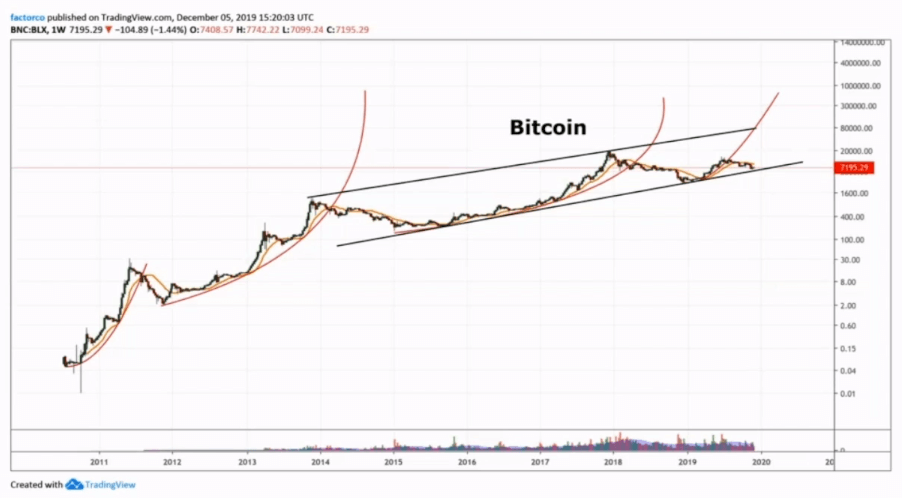
Now that Bitcoin moved aggressively to $4,000 within the last two days, Brandt suggested that the carnage may not be over yet. The chartist argued that under an unbiased interpretation of the charts, the pioneer cryptocurrency could reach market bottom below $1,000.
Brandt said:
“All along I have stated my belief that there was a 50% chance BTC was going to $100,000 and a 50% chance it would go to $0, or literally zero. Once we broke through $7,500 I placed my bets on zero.”
Despite the pessimistic outlook presented by Brandt, former Wall St. trader and VP at JP Morgan Chase Tone Vays believes that the way Bitcoin bounced off the $4,000 support level looks “very promising.”
Vays explained that markets usually bottom after capitulation, which seems to be what happened during the recent price action. These capitulations tend to drive prices to new lows, highlighted the analyst. However, Bitcoin is still trading above the December 2018 low of $3,215.
Vays affirmed:
“For those that ‘Bought the Dip’ under $4k lock it down as HODL. For those that missed it, I am comfortable buying it here, but also setting BTC Limit orders at $4,550, $3,550 & my ALL IN is at $2,750-2,950!”
Everything's not lost
While both Brandt and Vays expect a further downward movement, the TD sequential indicator is presenting a buy signal in the form of a red nine candlestick on BTC’s 3-day chart. This bullish formation estimates a one to four candlesticks pullback or the beginning of a new upward countdown.

Time will tell whether the current price level indeed represents an opportunity to “buy the dip” or if it is just the beginning of a further sell-off.