The Bitcoin network is currently a ghost town as price is being controlled elsewhere
Fees, mempool pressure, and on-chain demand are telling a different story beneath the price recovery.

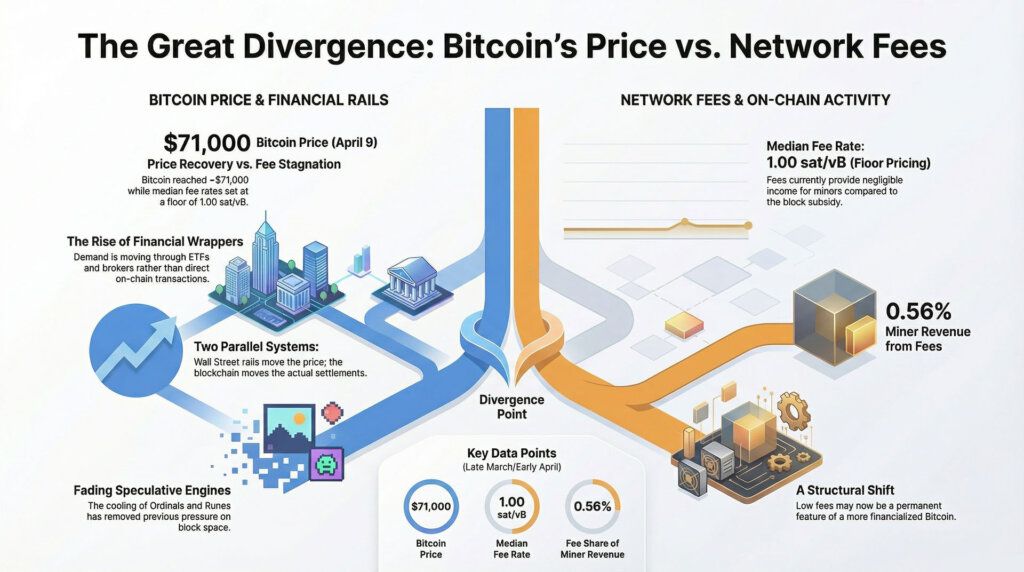
Bitcoin’s rebound to around $71,000 has reignited a familiar bullish conversation about price, liquidity, and positioning. It has also exposed a less comfortable fact inside the network itself.
The fee market has barely moved.
For a market that still treats on-chain congestion as a sign of organic demand, that divergence deserves more attention than another recap of macro tailwinds or ETF flow streaks.

On CryptoSlate’s Bitcoin price page, BTC was last trading at $70,990 on April 9, down 0.86% over 24 hours, up 6.11% over seven days, and up 0.85% over 30 days.
Price has clearly recovered from the lower end of its recent range, while the base layer still looks calm, cheap, and uncrowded.
The disconnect says something important about where this move is actually happening. More Bitcoin demand is being expressed through financial wrappers, broker channels, and ETF rails than through users competing for block space on-chain.
The price move can still be durable under that setup. The signal it sends is different.
A recent Bitcoin block space report covering March 19 to March 26 found that the median fee rate opened at 1.13 sat/vB and remained at 1.00 sat/vB for the rest of the week. In practical terms, that is floor pricing.
Users were still able to get confirmed without paying up for scarce space. Across 1,028 blocks, the report counted just 18.03 BTC in total fees, or roughly 0.0175 BTC per block.
Even more striking, those fees accounted for only 0.56% of miner revenue for the week, compared with 3,212.5 BTC from subsidy.
Price has recovered, while the fee market still looks half asleep
Those numbers are unusually soft for a market trading back around $71,000. Earlier cycle logic conditioned the market to expect a rising Bitcoin price to coincide with busier blocks, more contested inclusion, and a fee market that starts climbing before most people notice.
That reflex still shapes how many crypto participants interpret demand. The current market is sending a different message.
Price can recover even while on-chain urgency remains muted.
One reason the fee market looks so subdued is that Bitcoin has already lost one of the speculative demand engines that distorted block-space pricing in prior phases. Ordinals and other inscriptions once created a visible burst of non-monetary demand for inclusion, while the Runes launch briefly did the same on an even larger scale around the 2024 halving.
That impulse has faded materially. The chain is no longer dealing with the same inscription-driven scramble for block space, which means today’s low-fee environment is not just a story about healthy efficiency or quiet user behavior.
It also reflects the absence of a category that had previously inflated transaction counts and put pressure on fees.

That context helps explain why a rebound in BTC can coexist with such a soft fee backdrop. Earlier in the cycle, Ordinals, inscriptions, and later Runes gave miners an extra revenue stream and gave observers a reason to treat mempool stress as proof of expanding demand.
Today, that support looks much thinner. The speculative traffic that once crowded the chain has cooled, leaving Bitcoin more dependent on either organic settlement demand or price-led financial flows to do the heavy lifting.
In that sense, it's also about what has already left the building.
Part of that dynamic comes from the fact that the pipes carrying demand have changed. A buyer using a spot ETF, a broker product, or a treasury vehicle can push capital into Bitcoin exposure without creating the same base-layer footprint as a user moving coins directly across the chain.
That distinction has grown more important as Bitcoin access has become more financialized. Farside’s daily ETF flow data showed a $471.4 million inflow on April 6, followed by outflows of $159.1 million on April 7 and $124.5 million on April 8.
The day-to-day swings were relatively modest, yet the broader point is that flows through these wrappers remain an active transmission channel for demand. Spot Bitcoin ETFs recorded $1.3 billion in net inflows for the month, the first positive month since October.
That is the hidden mechanism behind the current divergence. Bitcoin demand is being split across two systems.
One system moves price through funds, adviser platforms, and broker access. The other system moves transactions through the blockchain itself.
Right now, the first system looks more active than the second. That leaves the fee market looking sleepy even as the asset itself regains altitude.
The result is a rebound that feels bullish on screens, while the network’s own pricing of block space remains subdued. That combination carries a different implication than a full-on-chain revival.
It suggests the recovery has broad distribution through financial rails, while direct pressure on Bitcoin’s settlement layer remains limited. For anyone still treating mempool stress as a simple proxy for demand, the current setup is a reminder that the market structure around Bitcoin has changed faster than many of the instincts people still use to interpret it.
Glassnode’s April 1 weekly market note described Bitcoin as rangebound between $60,000 and $70,000 and argued that spot demand was showing early signs of absorption, while still lacking the conviction needed for a sustained breakout. Glassnode also flagged dense overhead supply between $80,000 and $126,000.
That range framework fits the current divergence well. Bitcoin has bounced, yet the fee market has not repriced to indicate broad urgency, widespread settlement demand, or a sudden scramble for base-layer access.
Low fees point to where demand is landing, and to what miners still are not getting paid for
A separate report citing Glassnode data on March fee activity said Bitcoin’s 30-day simple moving average for daily transaction fees had fallen to 2.5 BTC per day in March 2026. The article described that as the lowest level since March 2011.
The precise historical framing requires caution until the underlying primary chart is checked directly, yet the directional message lines up with the broader evidence. Fee conditions have tightened significantly, and they have stayed tight even as BTC regained ground.
That compression creates an important divide between price strength and network monetization. Users get a friendlier chain. Miners get very little incremental revenue from transaction demand.
After the halving, that revenue mix carries more weight than it did when the subsidy was doing even more of the work. The March 19 to March 26 block space report quantified the issue cleanly, with fees contributing just 0.56% of miner revenue for the week.
For miners, a rally that does not trigger a fee response still helps through price, while leaving the network’s internal revenue base largely unchanged.
The difference becomes easier to see once Bitcoin is framed as both an asset and a network, with each side expressing demand in different ways. The asset side benefits from ETF adoption, adviser access, treasury accumulation, and improved risk appetite.
The network side benefits from actual users, transfers, settlements, and transactions that compete for limited capacity. These two layers can reinforce each other.
They can also drift apart for meaningful stretches. That is where the market sits now.
There is also a practical point in the current setup. A calm mempool does not automatically translate into weak Bitcoin.
It suggests that the rebound offers less evidence of resurgent on-chain intensity than the price alone might imply. A base-layer fee response would indicate that financial demand was spilling over into actual settlement contention.
Without that response, a different interpretation moves closer to the center: one in which Wall Street distribution is doing more of the immediate lifting than users transacting natively on-chain.
That outside-world collision gives the current divergence its explanatory power. Bitcoin is increasingly embedded in mainstream financial plumbing.
Morgan Stanley has just launched a low-fee spot Bitcoin ETF, and Charles Schwab is preparing direct spot Bitcoin and Ethereum trading by mid-2026. The access channels around Bitcoin continue to widen.
As they widen, price can move along those rails long before the mempool signals a similar demand pulse.

The next test sits in the fee market, the miner revenue mix, and whether price strength spreads into actual settlement demand
The immediate question is whether the current divergence is temporary or structural. There are credible arguments on both sides, and the next few weeks should help narrow the range of plausible outcomes.
The first path is a continuation of the current pattern. ETF and broker demand continue to support the price; Bitcoin holds near the upper end of its recent range, and fee rates remain close to the floor.
That would strengthen the case that this rebound is being carried primarily by wrapper-led flows rather than a broad-based return of native transaction demand. It would also reinforce the idea that price can recover through distribution and access to capital, while the chain’s own fee market remains calm.
The second path is a catch-up move in block-space demand. If the price recovery begins to spill over into actual transaction competition, the market should start to see higher fee estimates, deeper backlogs, more sustained pressure in the mempool, and a larger fee share in miner revenue.
That shift would change the interpretation of the rally. It would suggest that the move is spreading from exposure into usage, which would give the recovery a different kind of durability.
The third path would leave the current divergence looking more like a warning than a curiosity. If ETF flows roll over again, price slips back into the lower half of Glassnode’s recent range, and fee conditions still stay weak, the market will have stronger grounds to treat the rebound as a positioning move that never developed into broader transactional demand.
In that setup, the mempool’s quietness would stop looking incidental and start looking diagnostic.
A fourth path sits closer to miner economics than price direction. If fees remain this subdued while miners continue operating in a post-halving environment, attention will shift toward how the network is being monetized.
CoinShares’ Q1 2026 mining report described the final quarter of 2025 as the toughest quarter for miners since the 2024 halving, with a sharp price drawdown and near-record hashrate weighing on margins. A prolonged stretch of low fees would keep that pressure in focus.
Price appreciation helps, while a broader fee contribution would help more.
That is why the fee market deserves to sit much closer to the center of the current Bitcoin conversation. A move back toward $71,000 is meaningful.
It also leaves an open question. Where, exactly, is the demand becoming real?
Right now, the strongest answer is that demand is becoming real in financial products faster than it is in Bitcoin’s own block space.
That carries a measured but important implication for how this market should be understood. The rebound has gained traction through the channels Bitcoin spent years trying to enter: funds, advisers, brokers, and mainstream portfolio plumbing.
The blockchain itself has yet to show the same urgency in its pricing of access. For anyone watching Bitcoin as both a monetary asset and a network, that gap is the signal.
The market has moved higher. The chain has barely flinched.
The next round of evidence will come from whether that calm finally breaks, or whether Bitcoin’s most powerful demand engine now lives one layer removed from Bitcoin itself.
Bitcoin is -0.12% over the past 24 hours and currently sits at rank #1 by market cap.
More Bitcoin market context Supply, launch date, volume flow, and price-cycle context.
Where the broader market sits right now
Right now, the total crypto market is valued at $2.21T with $39.18B in 24-hour volume. Bitcoin dominance sits at 58.72%. Explore the market