Bitcoin breaks critical support as dollar and oil move together, raising risk of a deeper drop
Bitcoin slipped under a key support zone as macro pressure builds, leaving a deeper move in play if buyers fail to reclaim control.

Bitcoin spent the past 24 hours returning to the key levels on my channel map rather than continuing its breakout. It tested a boundary, failed to convert that test into acceptance, and rotated lower into the next pocket of support memory.
Bitcoin price slid from the upper $68,000s and low $69,000s to around $66,400 by late morning in Europe on April 2. The 24-hour move came in at roughly 3%, with the high near $69,170 and the low near $66,218.
Over 48 hours, the net change stayed close to flat, yet the path inside that window shifted the balance of the chart lower. Price gave up the white shelf near $66,894, rejected a retest, and left the market trading beneath a level that had previously held the local structure together.
Why this matters: What changed is not just the price move but the level it broke. Bitcoin lost a support zone that had been holding the recent structure together, and failed to reclaim it on the first retest. At the same time, the dollar and oil moved higher together, a combination that tends to pressure liquidity and risk appetite. That pairing raises the bar for any immediate recovery and puts the next lower support zones back into focus.
That pattern sits squarely inside the 2024 channel framework, first laid out in Bitcoin channel predictions, aligning with market movements over 6 months. The premise was simple and practical.
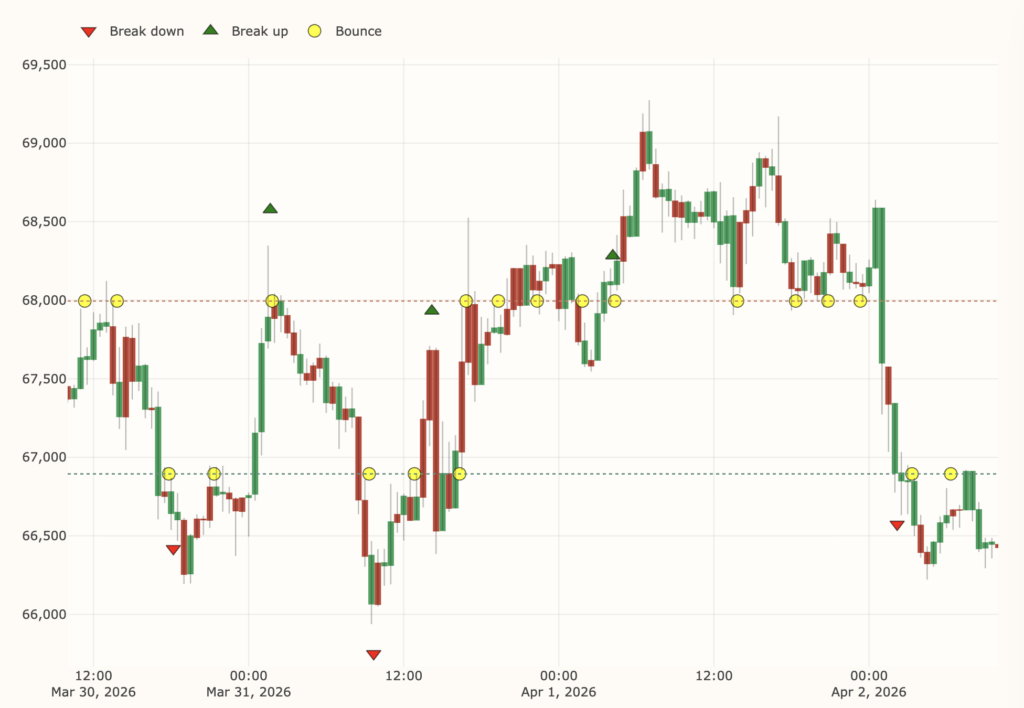
Repeating close prices on the 30-minute chart can identify where leverage, stop placement, and spot liquidity tend to cluster. Those shelves have kept showing up at the turning points.
They have framed rebounds, capped rallies, and guided the path between them with more consistency than many of the more elaborate narratives built around Bitcoin.
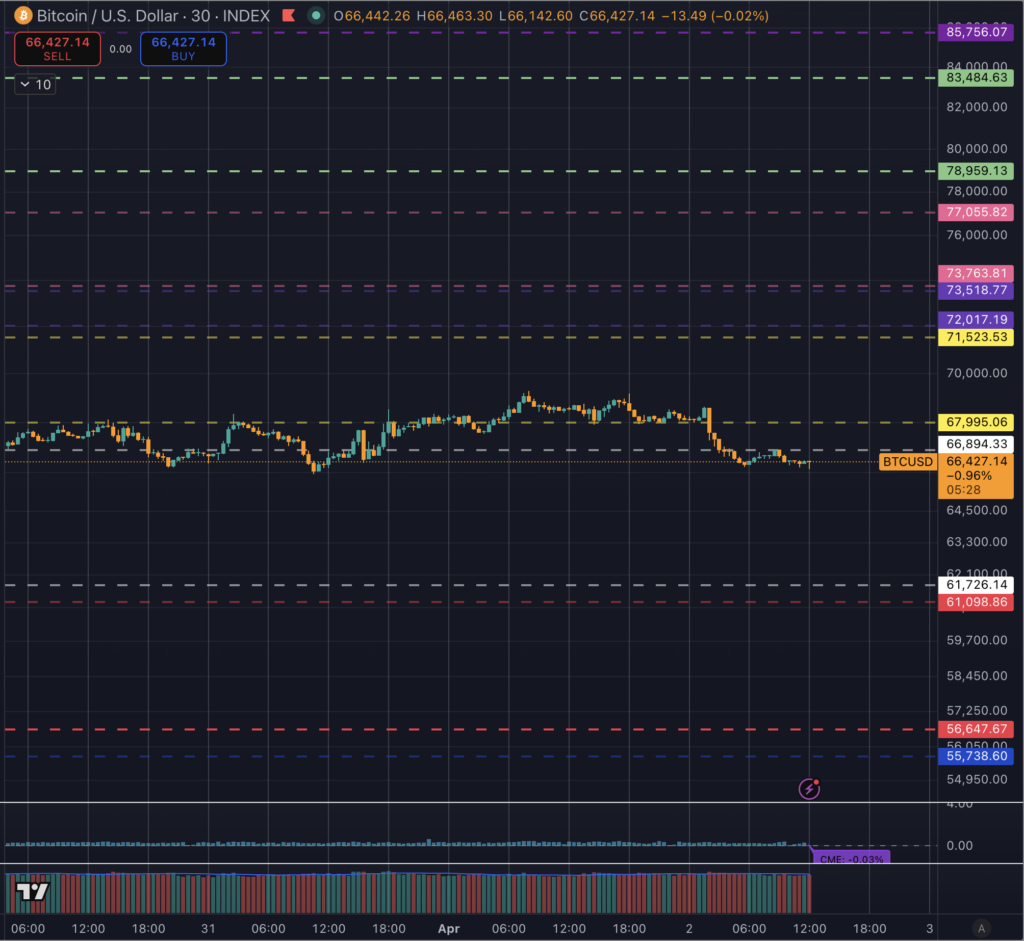
The last two days developed in three steps. First, Bitcoin spent time in the upper half of the near-term range, pushing back toward the yellow boundary near $67,995.
Second, the move stalled before any real acceptance could build above that shelf. Third, the chart rolled over sharply and carried price through the white line at $66,894 before finding a temporary footing in the mid $66,000s.
That sequence shows where control sits right now. Buyers still have a path back into the range, though that path starts with repair.
Price needs a reclaim of $66,894, then a push back through $67,995, before the structure looks constructive again.
Bitcoin lost the shelf it needed to hold, and the near-term structure turned lower
The same logic that led Bitcoin to fail 7 times to break $71,500. Repeated failure at a level adds weight to the next test.
A ceiling becomes a lid when sellers step down and meet price earlier, and a floor becomes vulnerable when buyers lose the urgency to defend it on first contact. In that February piece, the key level was $71,500, with the next friction zones above at around $72,000 and then $73,700 to $73,800.
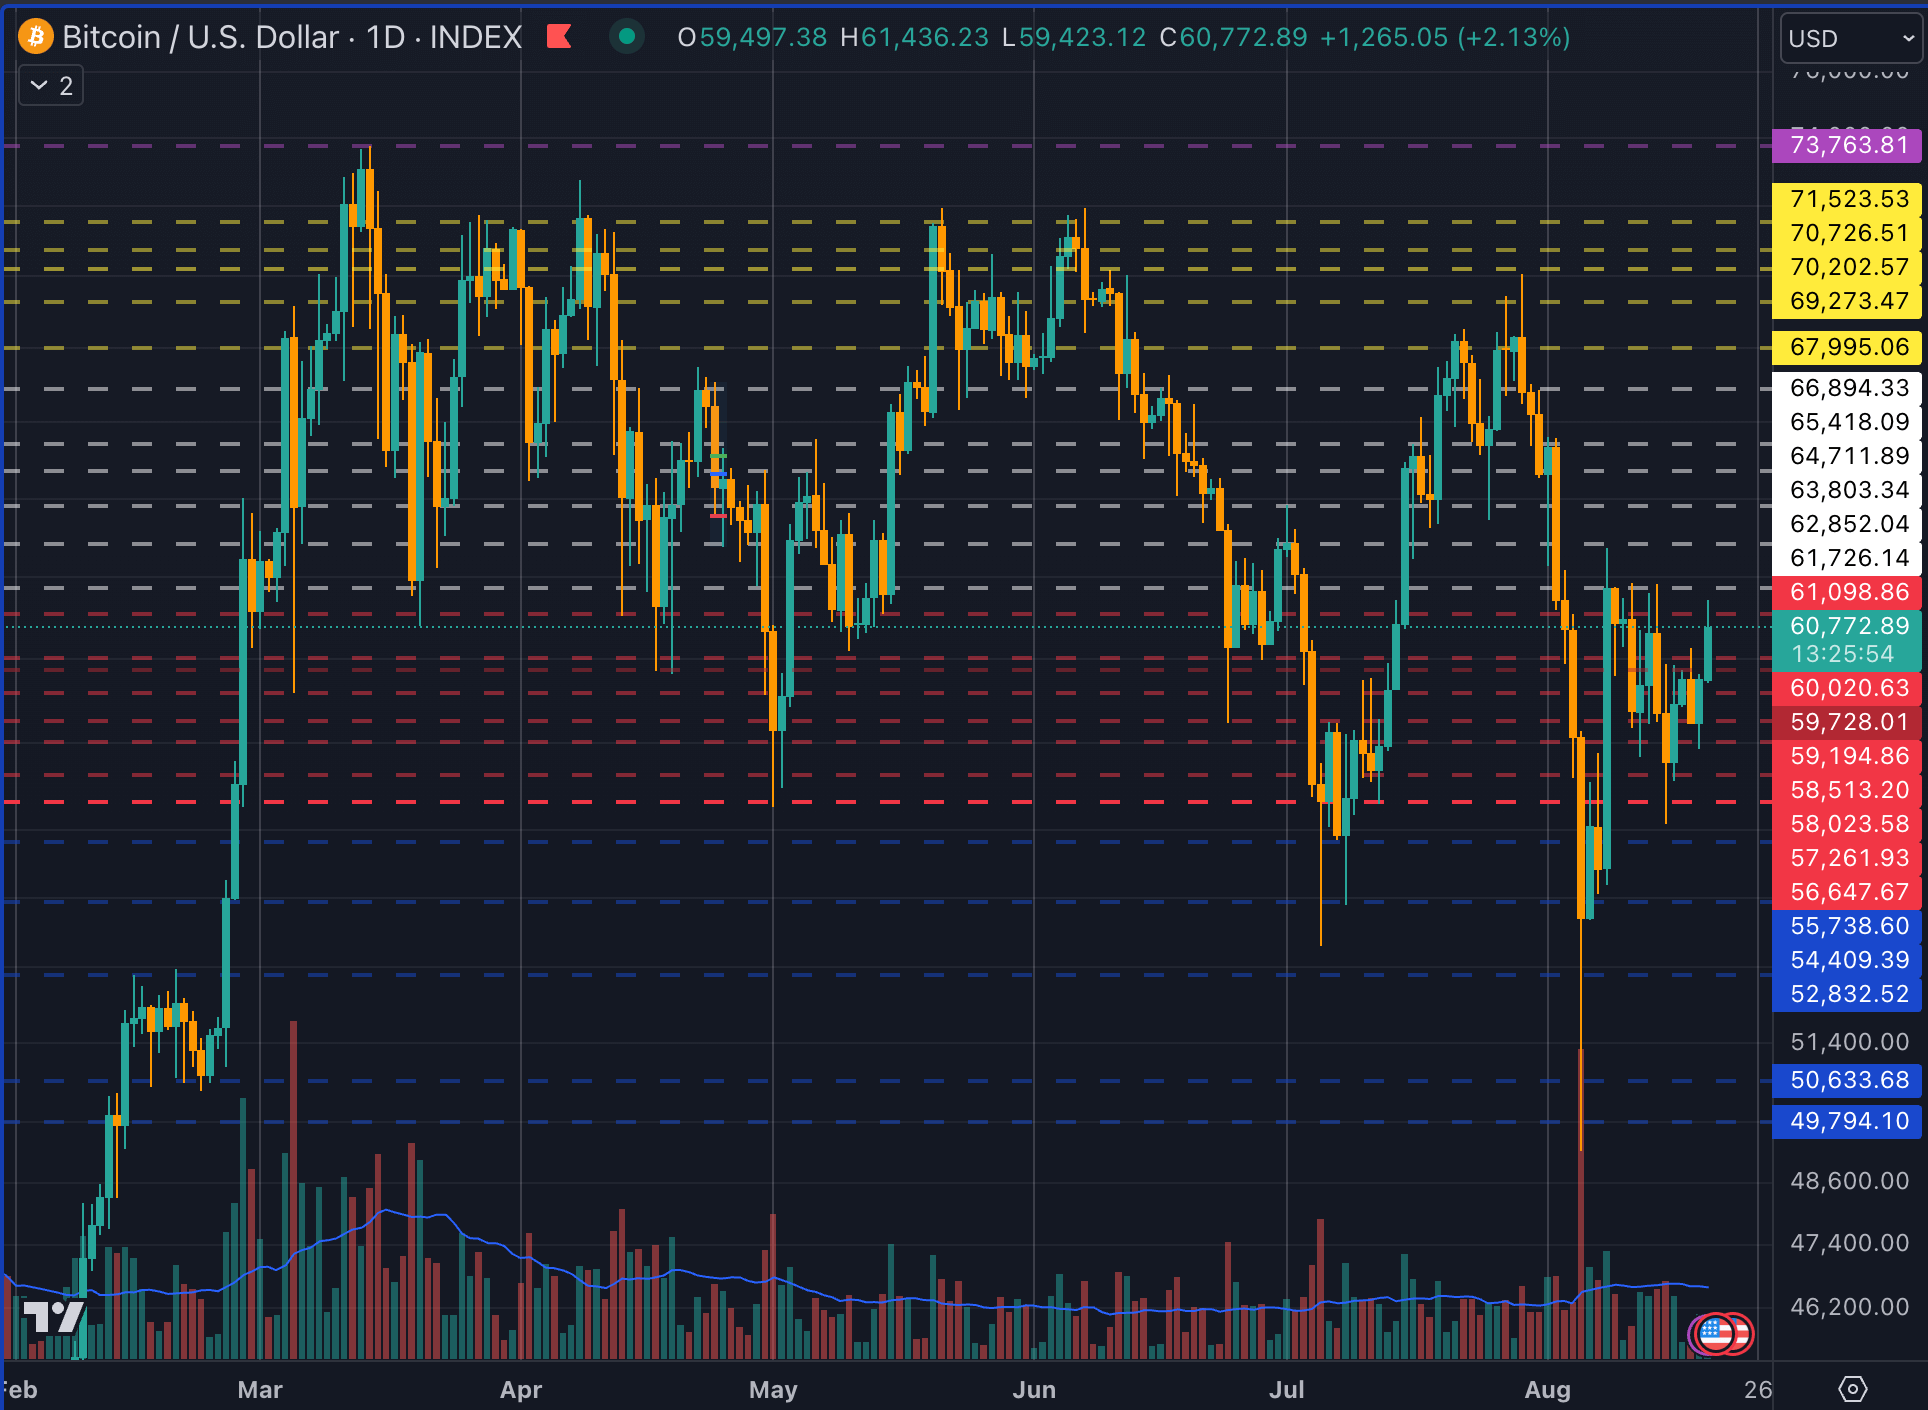
Below, I flagged the same shelves visible on the current chart: $68,000, then $66,900, with deeper support in the low $61,000s. That ladder remains intact today.
The difference is that Bitcoin has now moved one rung lower.
The practical sequence is straightforward. The market had room to recover while it held above the white shelf.
Once it lost that level and failed the retest, the burden shifted to buyers to prove that the drop was a flush rather than a new acceptance at a lower level. So far, the rebound has lacked authority.
A brief pop back toward the broken shelf printed the kind of weak retest that usually accompanies a market still under pressure. The candles after the drop look smaller, the bounce looks labored, and the range compression is taking place under resistance rather than above support.
The 24-hour numbers reinforce that view. Bitcoin fell around 3.02% from the close 24 hours earlier, while the 48-hour change stayed only marginally positive.
That combination often appears when a market has spent one day building a base and the next day giving it back. In other words, the chart preserved the wider range while damaging the near-term structure.
For a general audience, that distinction keeps the analysis anchored to thresholds rather than emotion. The market remains inside a ladder of known shelves.
It has moved from one shelf to the next. The immediate job for bulls is to recover $66,894, then $67,995.
The immediate risk for anyone leaning bullish is that continued trading below those levels draws attention to the lower white boundary around $61,726.
That lower target should already be familiar from my original channel work, where the channels were built to identify support and resistance rather than force a single directional call. It also lines up with the roadmap in “Bitcoin to $73k? Be prepared with the price levels to watch during a bear market“, where the key point was to treat lower shelves as historical liquidity pools.
The chart here fits that framework closely. Bitcoin is trading beneath a broken support shelf, and the next meaningful repair level sits above the current price.
Until that changes, the burden of proof remains on the upside.
Support memory still follows the same channel logic that shaped the earlier calls
These levels have held up well because they are built from where the market repeatedly closed, paused, and built positioning. Some zones carry memory because they spent hours or days there.
Other zones looked dramatic on the way up or down, yet offered weaker support because Bitcoin moved through them quickly, and the market built less inventory there.
That distinction shaped my October 2024 analysis in “Above the all-time high of $73.7k these could be the new resistance levels to watch”, where I argued that Bitcoin was trading at the top of a core price channel between $67.9k and $71.5k and that the zone between $71.5k and $73.7k had relatively little historical price action.
The implication was clear. Above the well-traded shelf, the market entered thinner territory where movement could become more abrupt.
The same logic applied later on the downside. In “It’s foolish to pretend Bitcoin’s story doesn’t include $79k this year”, I described the green band around $79,000 as a more substantial region because Bitcoin had spent time consolidating there during earlier legs of the cycle.
Below that sat the deeper structural supports in the red and blue channels, roughly $49,000 to $56,000, the area Bitcoin defended repeatedly before the move toward six figures. Then, in “Akiba’s medium-term $49k Bitcoin bear thesis – why this winter will be the shortest yet“, I framed $49,000 as a cyclical support case tied to miner stress, fee share, hashprice, and ETF flow elasticity.
Those longer-horizon calls operate on a different scale than the current 30-minute move, though they all rely on the same discipline: identify the shelf, assess how well the price is holding it, and define the next level that becomes relevant when it breaks.
The current move fits that sequence cleanly. Bitcoin approached the lower yellow boundary near $67,995 and could not hold it.
It then slid beneath the white shelf near $66,894. A 30-minute breakdown candle early on April 2 accelerated the move from the high $68,000s into the upper $67,000s, and follow-through selling pulled the price down toward the low $66,000s.
Once there, the market printed a small rebound and then drifted sideways beneath broken support. That behavior usually signals a market still negotiating lower inventory rather than preparing for an immediate reversal.
Anyone following the latter channel work through the six-figure phase will recognize the same design principle in “Bull or Bear? Today’s $106k retest decided Bitcoin’s fate” and “Bitcoin price next move: $92k or $79k? Let’s break it down”. The exact prices changed as Bitcoin moved through new territory, yet the method stayed the same.
A retest that holds opens the next band. A retest that fails hands control to the lower shelf.
The current chart falls into the second category. Price still sits below the broken shelf, which keeps the lower ladder in play.
Dollar strength and higher oil arrived at the same time as the breakdown, leaving reclaim levels above and deeper support below
The broader market context over the last 24 to 48 hours adds another layer to the chart. Alongside Bitcoin moving lower, the comparison view showed the U.S. Dollar Index rebounding above 100 while Brent crude pushed toward $108.
That combination tightens conditions around risk assets. A firmer dollar usually weighs on global liquidity at the margin, and higher oil prices can amplify inflation concerns, rate sensitivity, and geopolitical caution.
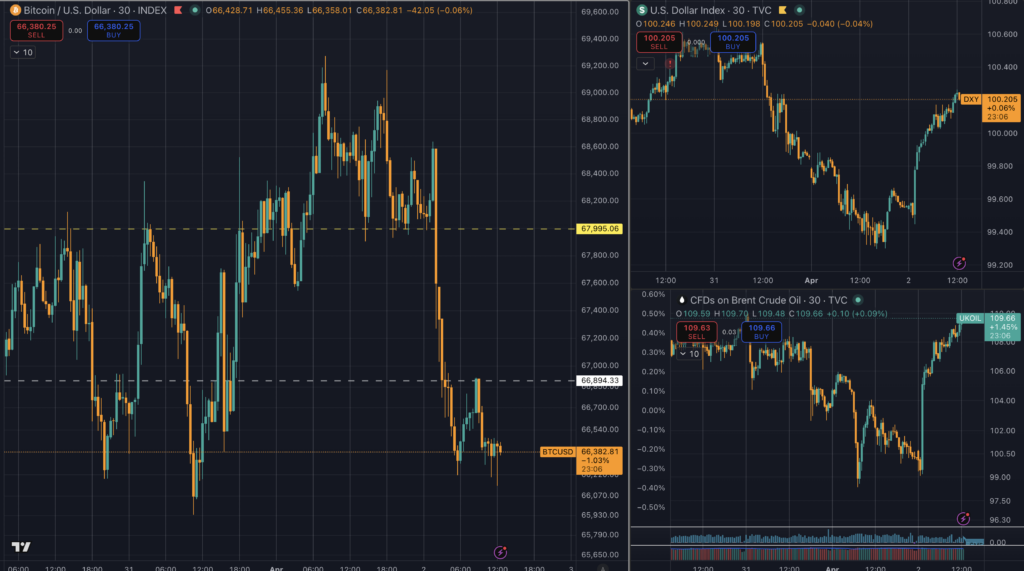
Bitcoin tends to trade with greater friction when both markets are moving in the same direction, against a softer risk backdrop.
That setting sits comfortably inside the framework of the later channel pieces. In the $79k piece, I wrote that liquidity could become the problem if ETF outflows intensified and risk appetite faded.
In the $49k bear thesis, I argued that negative 20-day ETF flows, alongside weaker miner economics, would increase the probability of sharper downside legs. In the seven failures at $71,500 analysis, I pointed to a macro environment where yields remained high enough to keep conditions tight.
The current move reflects that same type of pressure from a shorter time frame; a structurally important shelf gave way while the macro backdrop offered little relief.
For the practical map, the levels now do the heavy lifting. Resistance begins with $66,894, then expands to $67,995.
If Bitcoin regains both and spends time above them, the near-term damage begins to heal, and the next higher levels come back into view: $71,523, then $72,017, then the pair around $73,519 and $73,764, and then the upper extension near $77,056. Those higher levels are already familiar from the price discovery work above the old all-time high.
Support begins with the intraday low in the low $66,000s, though the stronger structural memory sits much lower, near $61,726. That leaves Bitcoin in a narrow but important condition.
It is close enough to reclaim broken support if buyers return with urgency, and close enough to invite a deeper sweep if they do not.
The conclusion remains the same one the chart has been offering since these channels were first drawn in early 2024. Bitcoin respects shelves until one gives way, and when one breaks, the next shelf tends to become the destination.
Over the last 24 hours, Bitcoin lost the shelf it needed to hold to keep the bounce credible. Over the last 48 hours, it preserved the wider range while shifting the short-term structure lower.
The next move now hinges on whether the price can climb back above $66,894 and $67,995 quickly enough to change the feel of the chart. Failing that, the lower white boundary near $61,726 moves back into focus as the next serious test on the ladder.