Explore CryptoSlate’s Institutional Playbook, a 3-part guide series on exchange due diligence, crypto-as-a-service, and token listing strategy for institutional teams.
Explore CryptoSlate’s Institutional Playbook, a 3-part guide series on exchange due diligence, crypto-as-a-service, and token listing strategy for institutional teams.
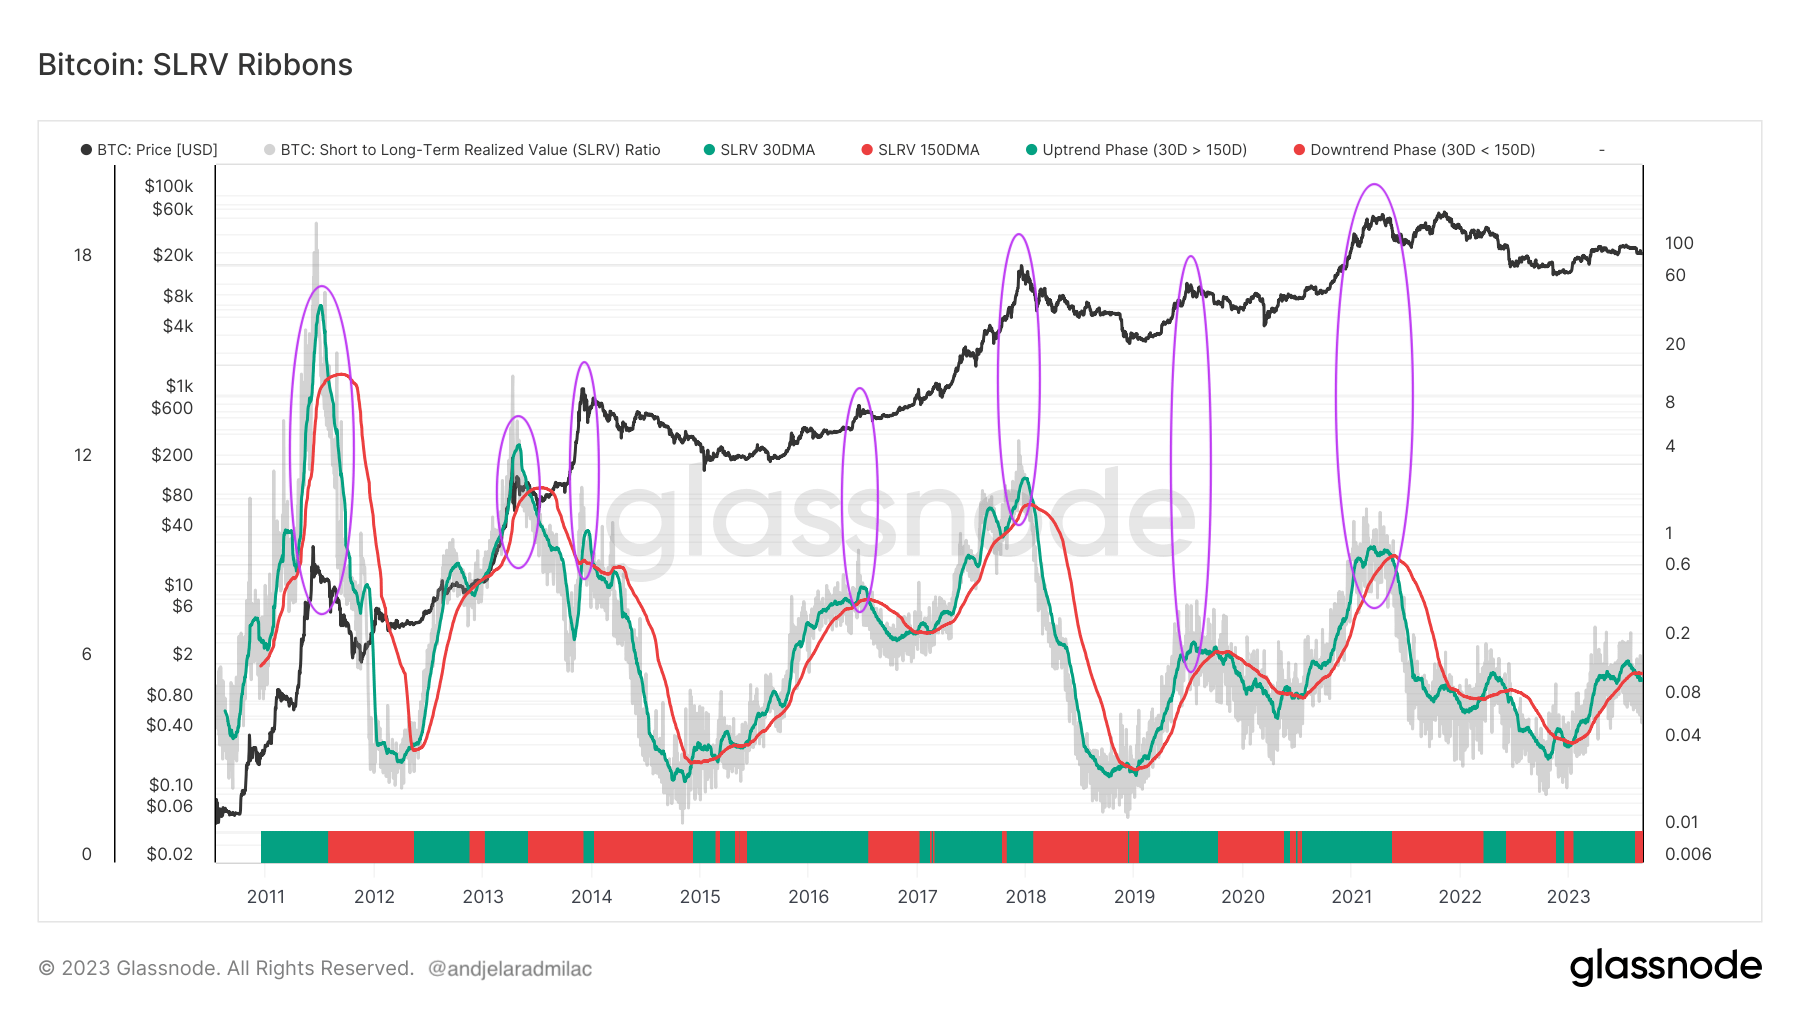
Spent Lifespan Relative Value (SLRV) offers a lens into the age of coins transacted on the Bitcoin network. Essentially, it helps differentiate the actions of long-term holders and short-term speculators, acting as a measure of market sentiment.
The SLRV ribbons are a visual representation of the SLRV ratio, plotted over different time frames, primarily the 30-day moving average (30DMA) and the 150-day moving average (150DMA). Their importance is underscored by their ability to offer a clear picture of market trends.
The 30DMA, representing a shorter time frame, captures the recent behavior of traders, typically associated with short-term holders or speculators who react to immediate market changes. On the other hand, the 150DMA, with its extended period, reflects the actions of long-term holders who base their decisions on prolonged market trends and are less influenced by short-term market fluctuations.
When the 30DMA is above the 150DMA, it indicates a bullish sentiment, with long-term holders not selling their coins. Conversely, when the 30DMA falls below the 150DMA, it signals a potential bearish turn, with older coins entering the market.
Historical data reveals a correlation between the peaks of the SLRV 30-day moving average (30DMA) and peaks in the Bitcoin price. As the SLRV 30DMA increases, a significant portion of long-term holders are selling their coins, often leading to a price peak. Following this, Bitcoin's price tends to drop when the SLRV 30DMA dips below the SLRV 150DMA. This inversion of the ribbons acts as a precursor to a potential market downturn.
CryptoSlate Daily Brief
Daily signals, zero noise.
Market-moving headlines and context delivered every morning in one tight read.
5-minute digest 100k+ readers
Free. No spam. Unsubscribe any time.
Whoops, looks like there was a problem. Please try again.
You’re subscribed. Welcome aboard.
Graph showing the SLRV ribbons from 2010 to 2023 (Source: Glassnode)
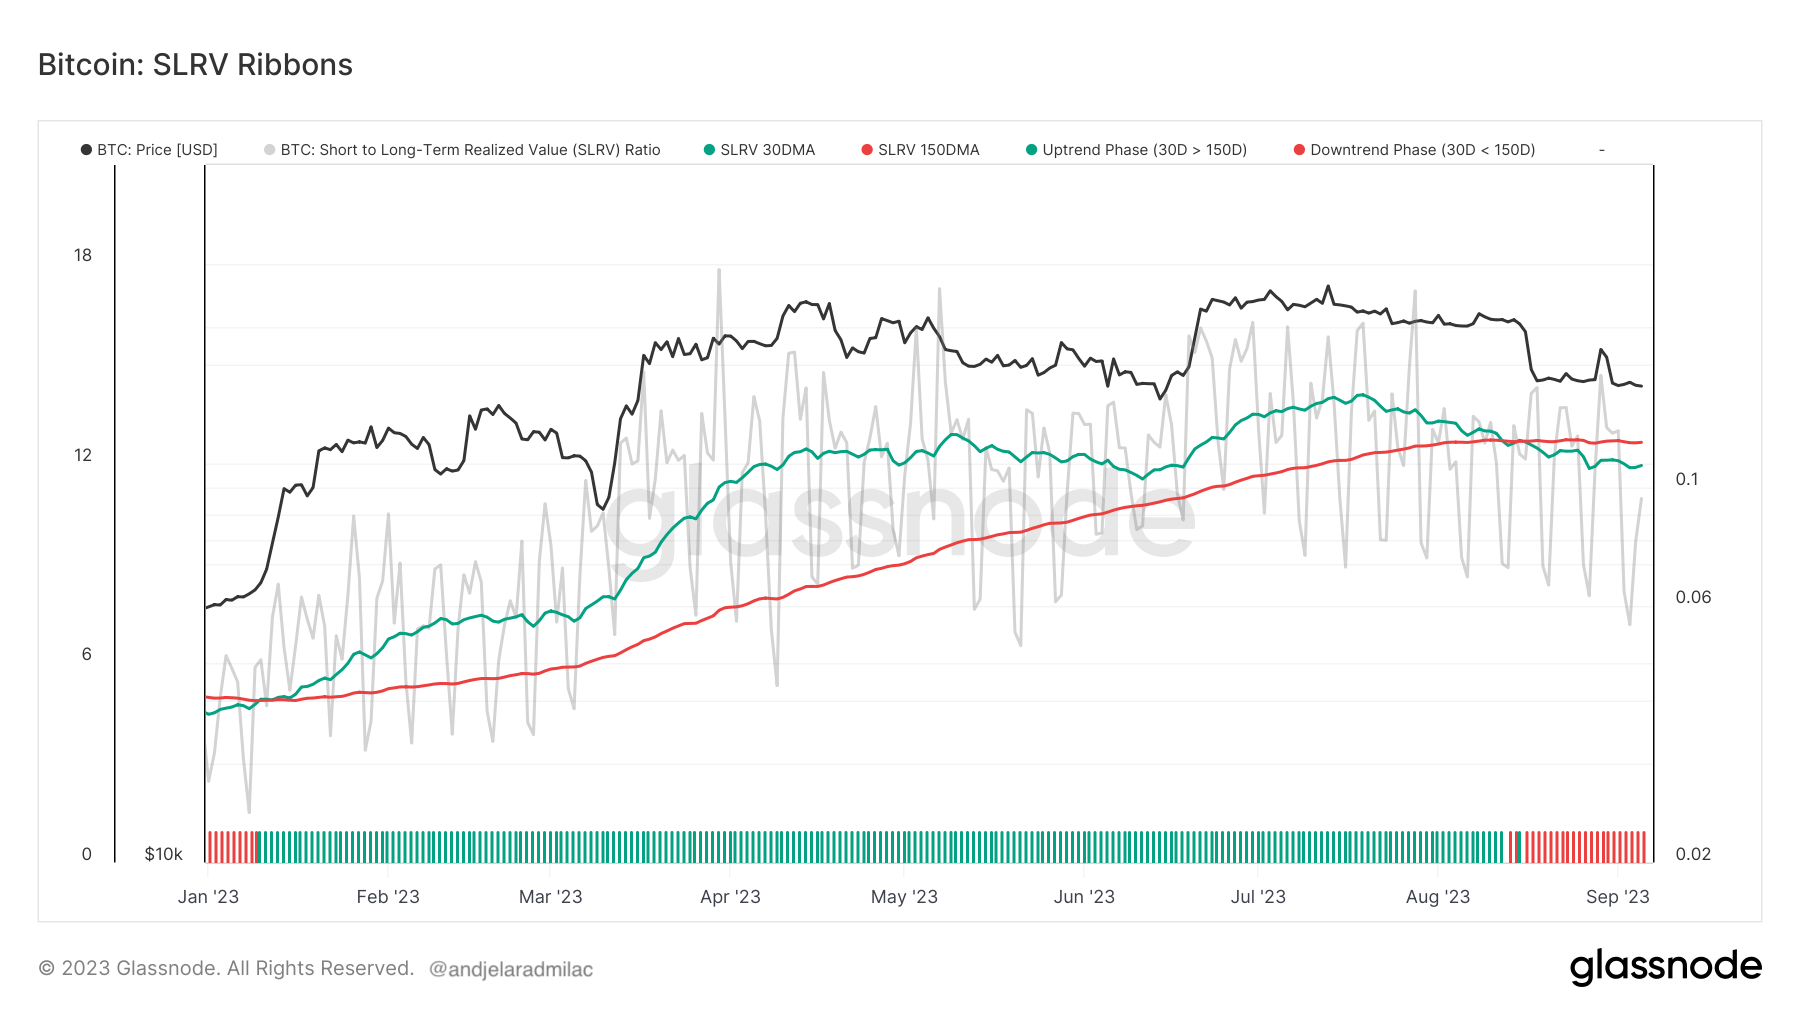
The SLRV 30DMA remained dominant over the 150DMA for most of the year.
Graph showing the SLRV ribbons YTD (Source: Glassnode)
However, a notable shift occurred on Aug.13, when the 150DMA briefly went above the 30DMA. Bitcoin's price was oscillating around the $29,200 mark at the time, confined within a tight trading range set in mid-June. By Aug. 15, the SLRV ribbons were fully inverted, with the 30DMA plunging below the 150DMA. This inversion was mirrored in Bitcoin's price, which took a hit, dropping from $29,200 to $26,000.
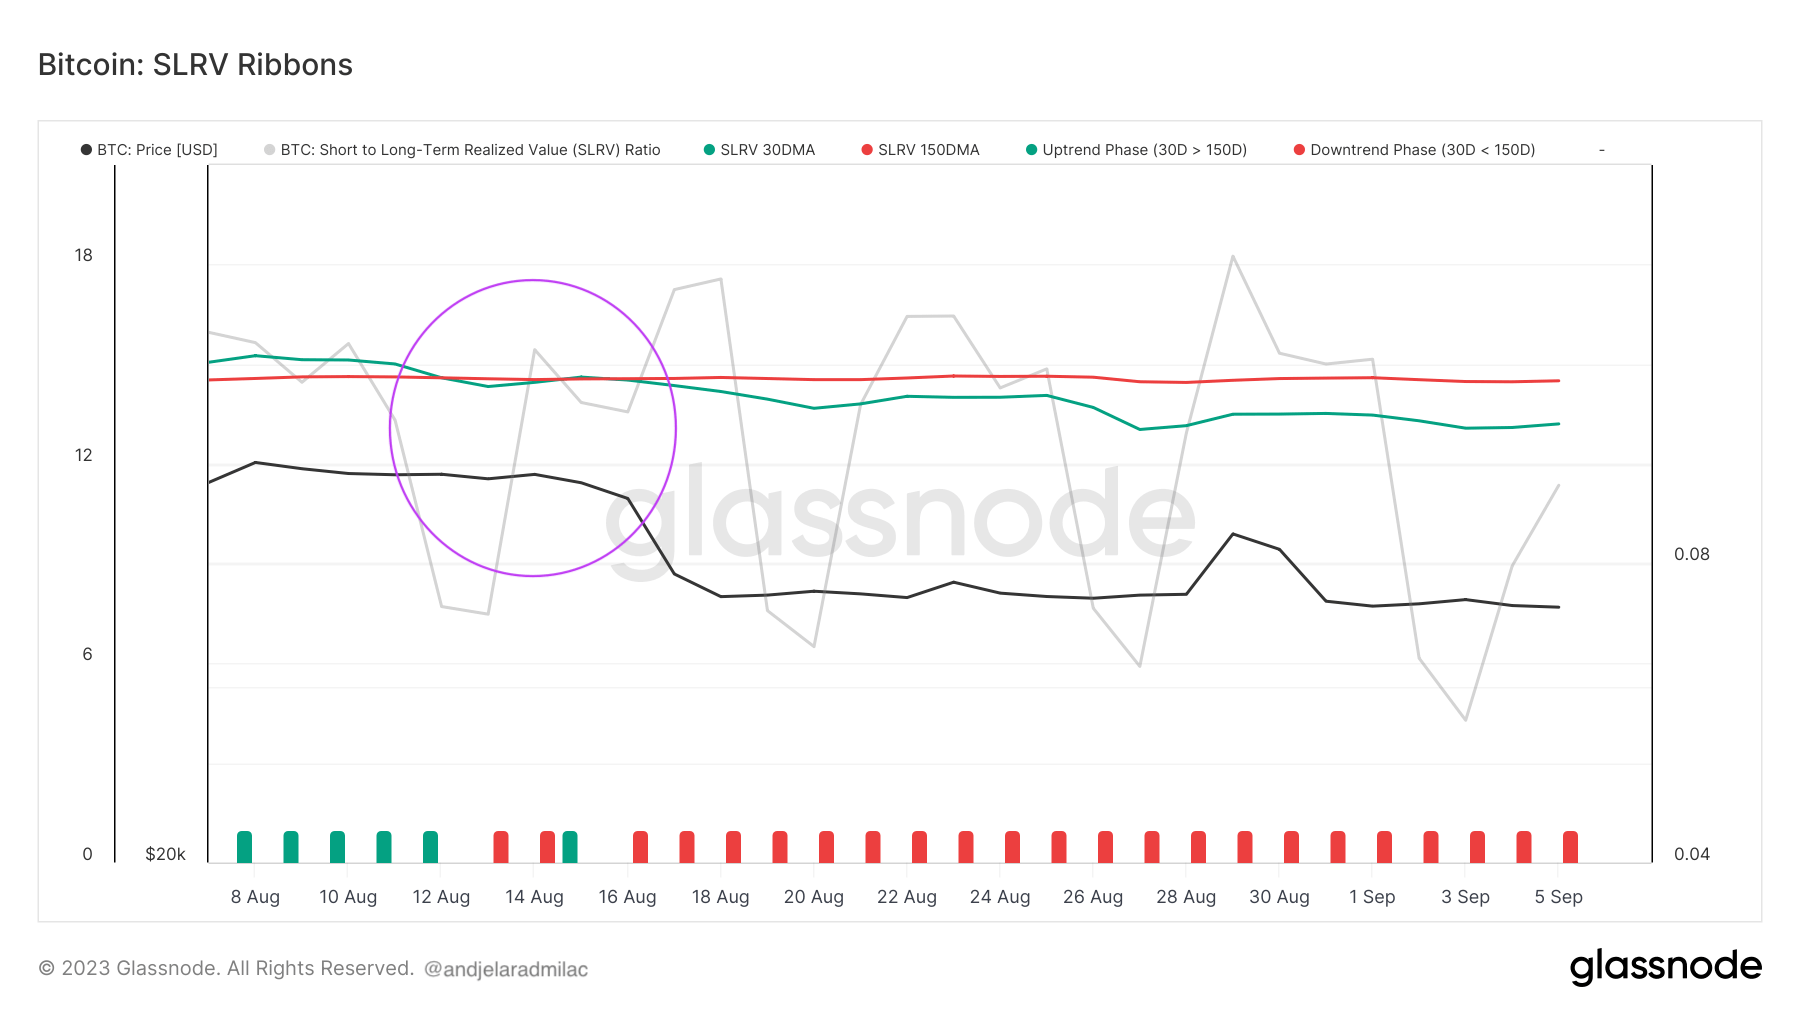
Graph showing the SLRV ribbons from in from Aug. 6 to Sep. 6, 2023 (Source: Glassnode)
As of Sep. 6, the SLRV ribbons remain inverted, with the downtrend showing no immediate signs of reversal. For market participants, this could be a sign of caution. The inversion of the SLRV ribbons, coupled with Bitcoin's price response, suggests that the market might be entering a phase where long-term holders are considering liquidating their positions. This could exert downward pressure on Bitcoin's price in the near term.