These critical on-chain metrics reveal that Bitcoin hit bottom

Cover art/illustration via CryptoSlate. Image includes combined content which may include the use of AI tools.
Regardless of the global economic meltdown, several on-chain metrics estimate that Bitcoin reached a market bottom and could be ready to resume its historic uptrend.
Fear reigns the market
Over the past few weeks, Bitcoin has been able to recover most of the losses incurred during the Mar. 12 crash, also known as Black Thursday. However, the Crypto Fear and Greed Index continues sensing “extreme fear” among market participants.
Many investors and crypto enthusiasts are still concerned about a possible retracement that could see the flagship cryptocurrency plunge below $7,000 again.
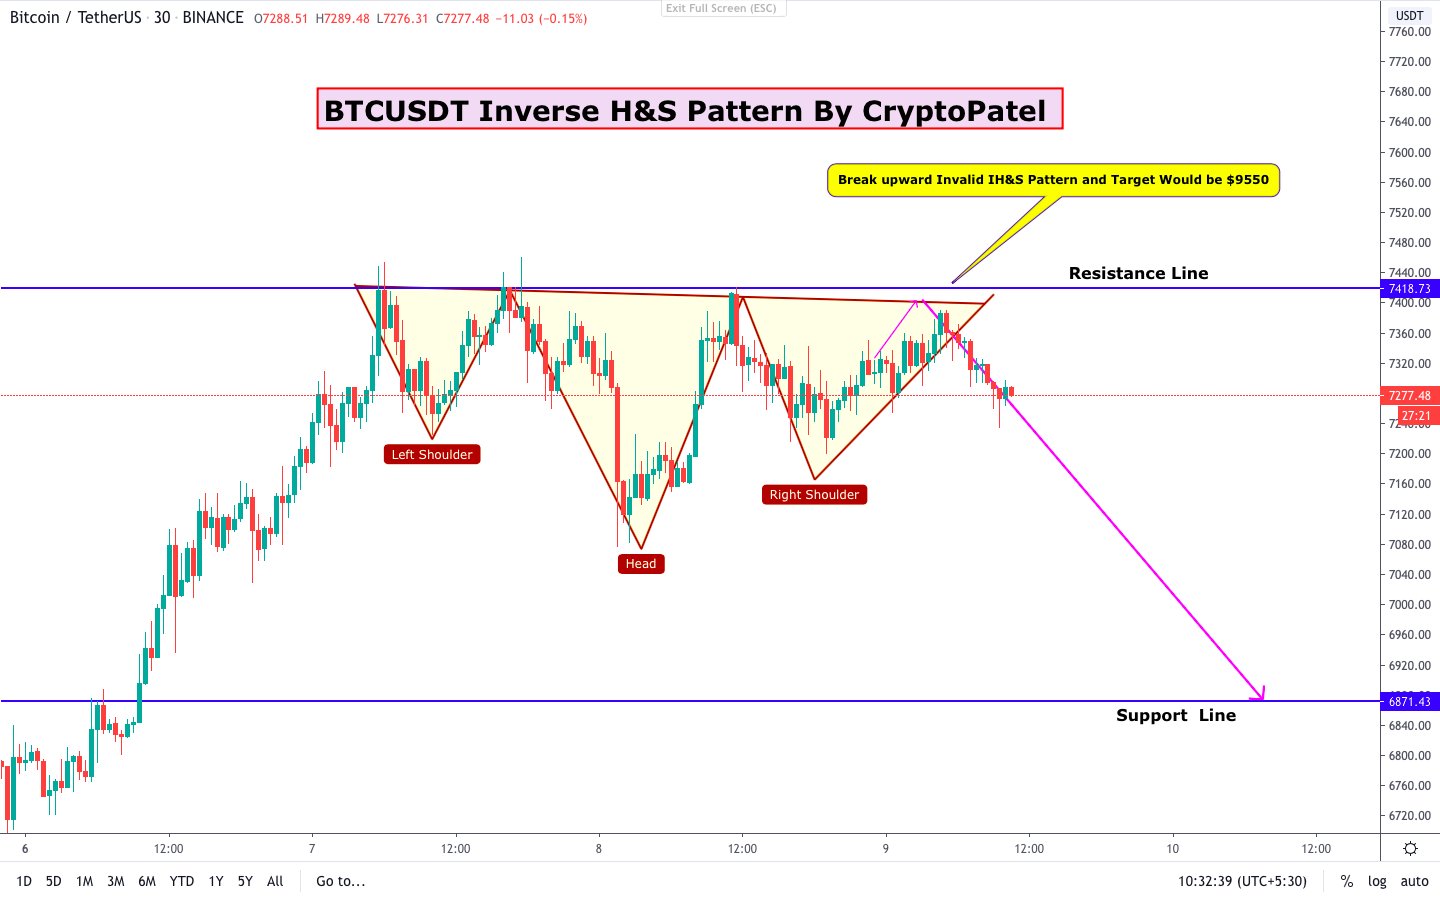
Patel Sahab, for instance, maintains that the $7,450 resistance level was able to hold and prevent Bitcoin from a further advance. This rejection resulted in the invalidation of an inverse head-and-shoulders pattern that was forming on BTC’s 30-min chart.
Now, the technical analyst expects a bearish impulse that could see the pioneer cryptocurrency dropping to $6,800 or lower.
Bitcoin shows signs of recovery
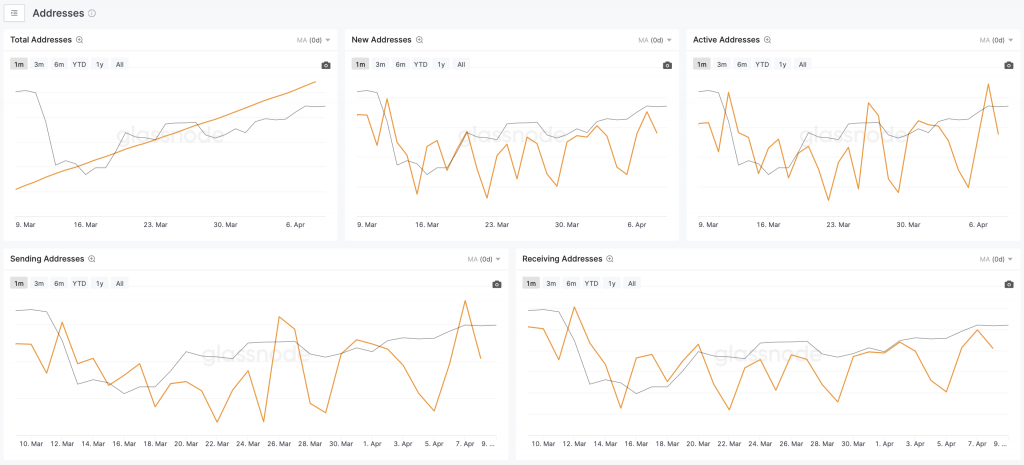
Despite the uncertainty in the market, on-chain fundamentals reveal that Bitcoin’s trading activity is back to normal. Data from Glassnode shows that after the recent crash there were a smaller number of large transactions, but the trend has been reversing as a larger number of smaller transactions are hitting the network.
The on-chain data and intelligence firm explained:
“The increase in active addresses and entities also indicates more widespread network use, as opposed to the smaller numbers of big movers that were active during the capitulation phase following last month's price drop. This return to normal network activity suggests that the panic triggered by the crash may have subsided, providing room for recovery.”
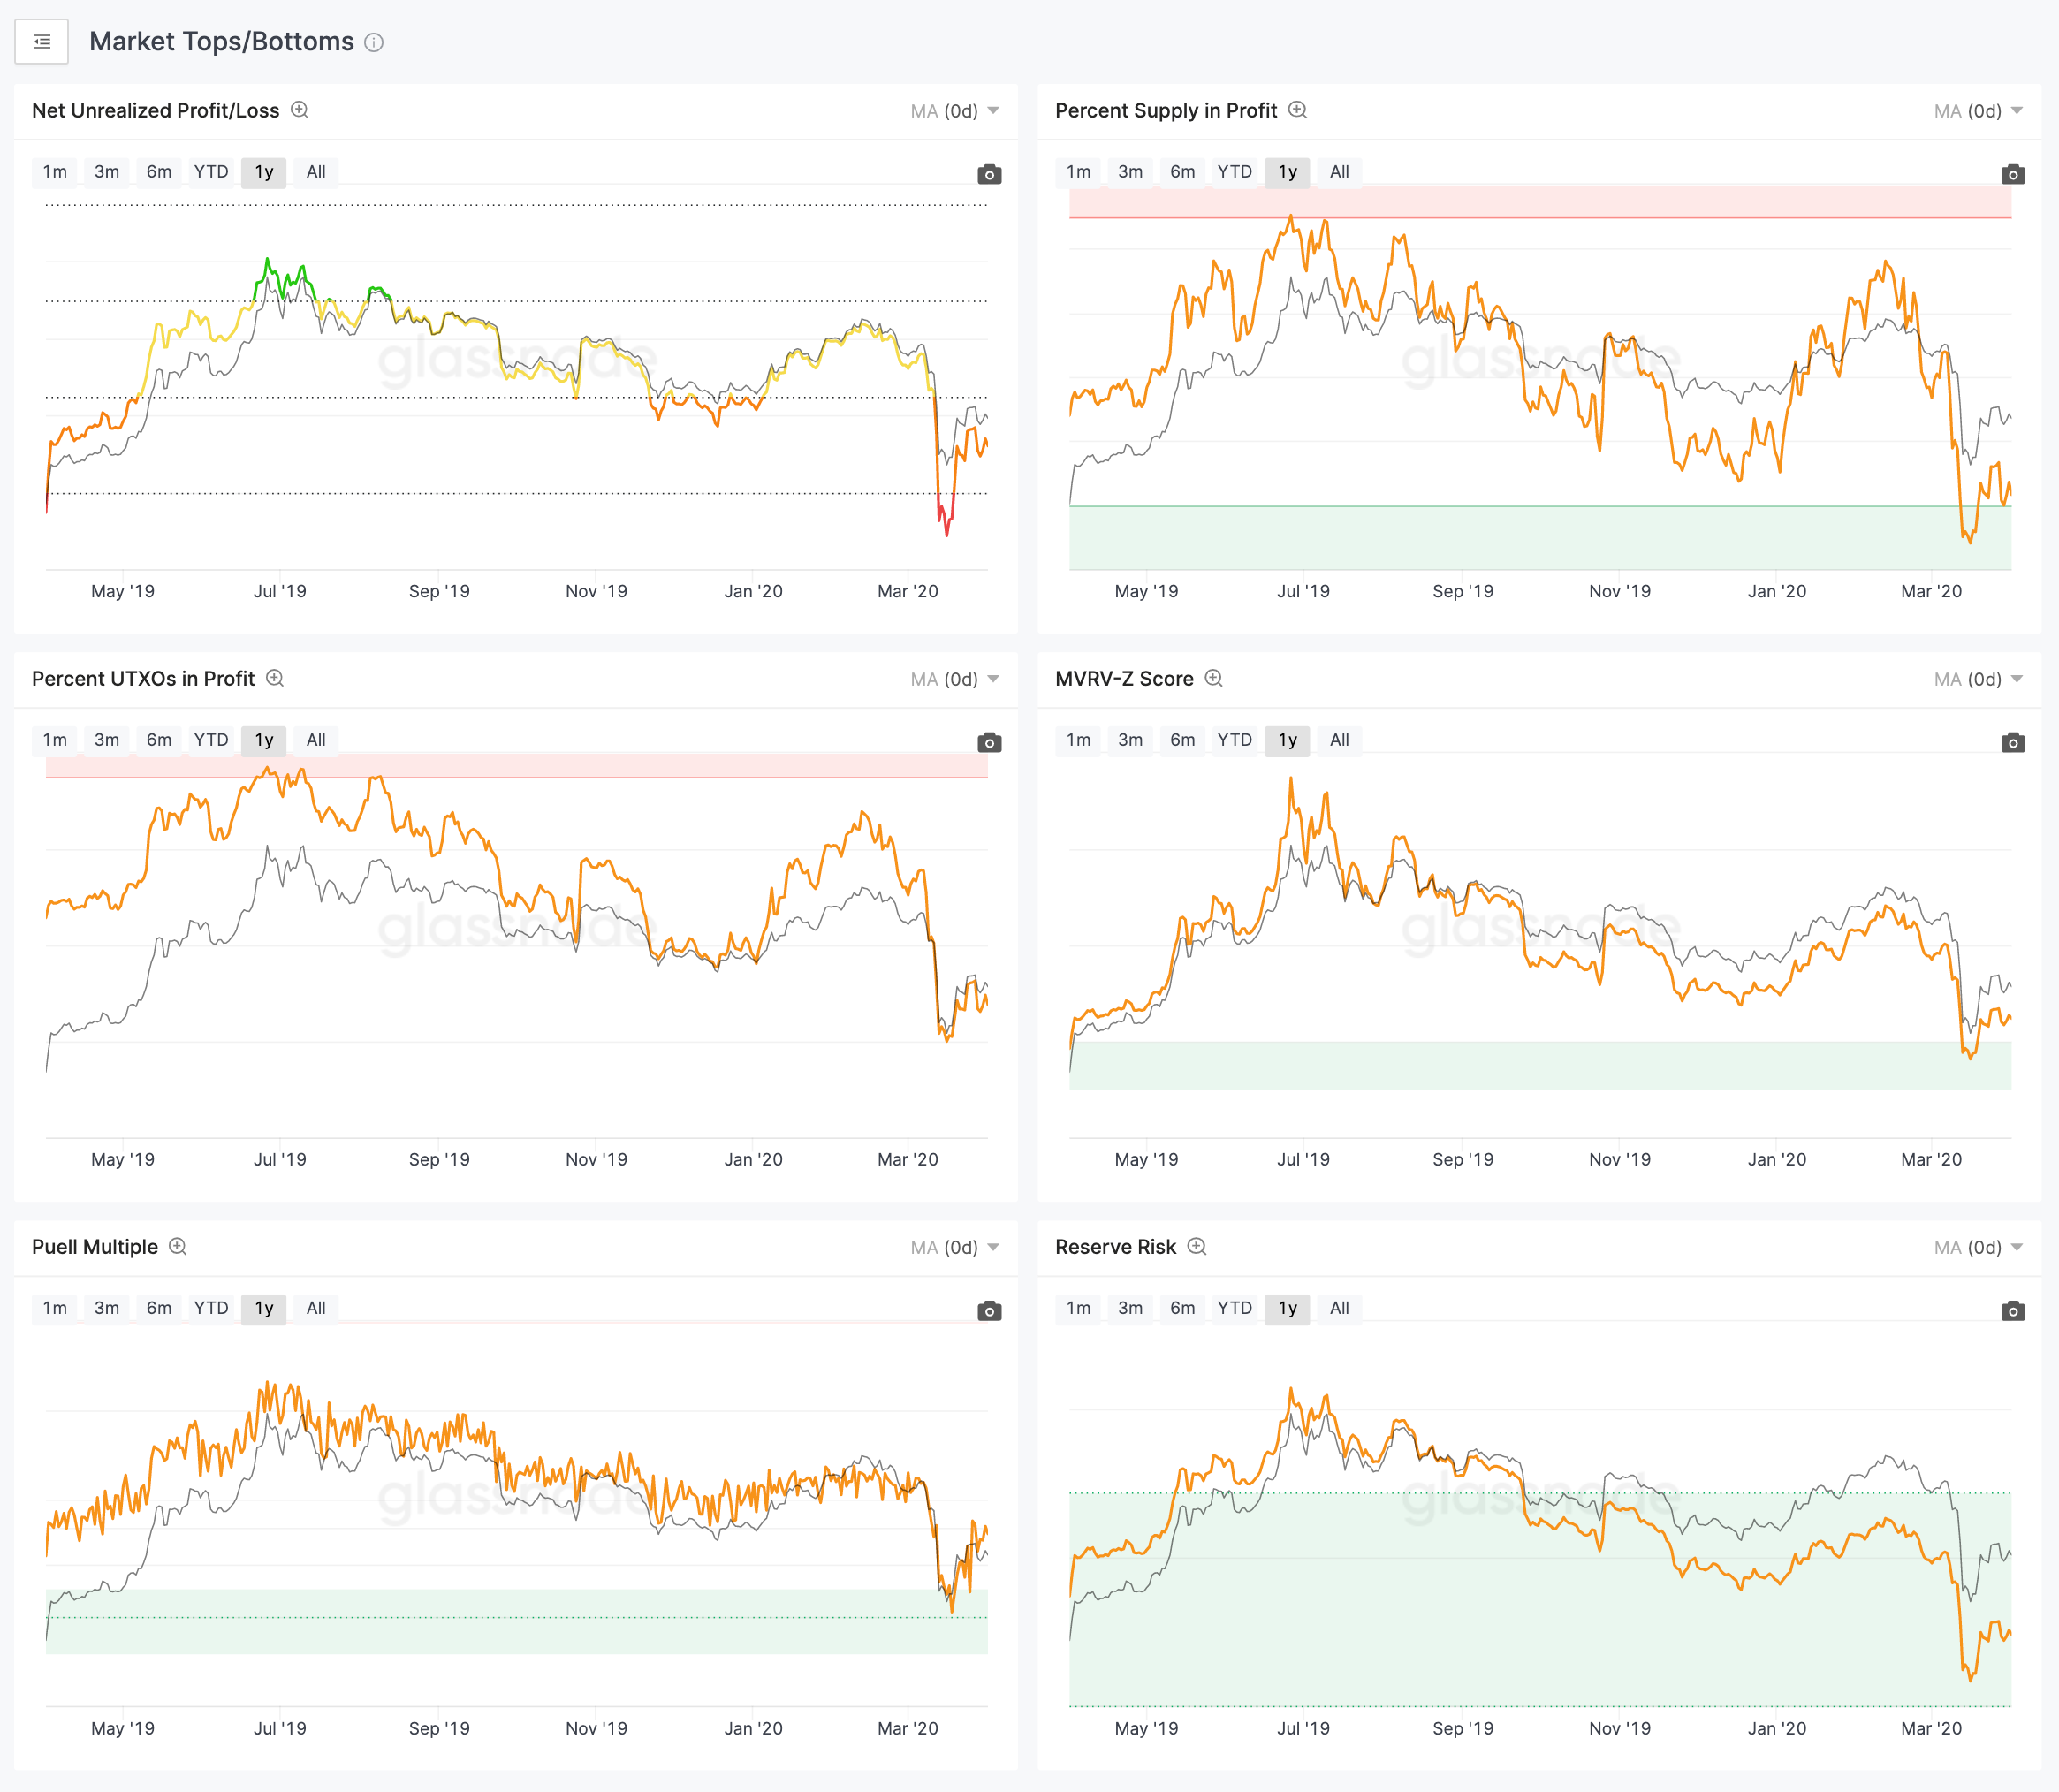
Additionally, multiple indexes have been signaling a potential shift in the market sentiment suggesting that the bellwether cryptocurrency hit bottom, according to Glassnode.
The Net Unrealized Profit/Loss indicator, for example, fell into the “red” or “capitulation” zone, which usually occurs when the market reaches a cyclical bottom. Meanwhile, the value of MVRV-Z Score plunged below zero in mid-March for the first time in over a year signaling that BTC was undervalued.
Even though these indicators have been extremely accurate at predicting market bottoms in the past, only time will tell whether or not history will repeat itself.
The current state of commotion in the global financial markets due to the spread of coronavirus has seen a significant number of investors rush to safe haven assets to protect their capital. The fly to safety could intensify if the financial turmoil deepens subsequently impacting Bitcoin’s price.