 Research: Miner data shows Bitcoin could have bottomed
 Research: Miner data shows Bitcoin could have bottomed
Hash ribbons, miner balances, mining difficulty, and the Puell Multiple all show that Bitcoin reached its bottom and could be recovering.

Cover art/illustration via CryptoSlate. Image includes combined content which may include AI-generated content.
Catching the coveted Bitcoin bottom requires analyzing more than just its price. One of the most reliable indicators of market bottoms has historically been miner data. Often considered to be one of the most resilient players in the crypto ecosystem, miners capitulate only when Bitcoin becomes too expensive to mine.
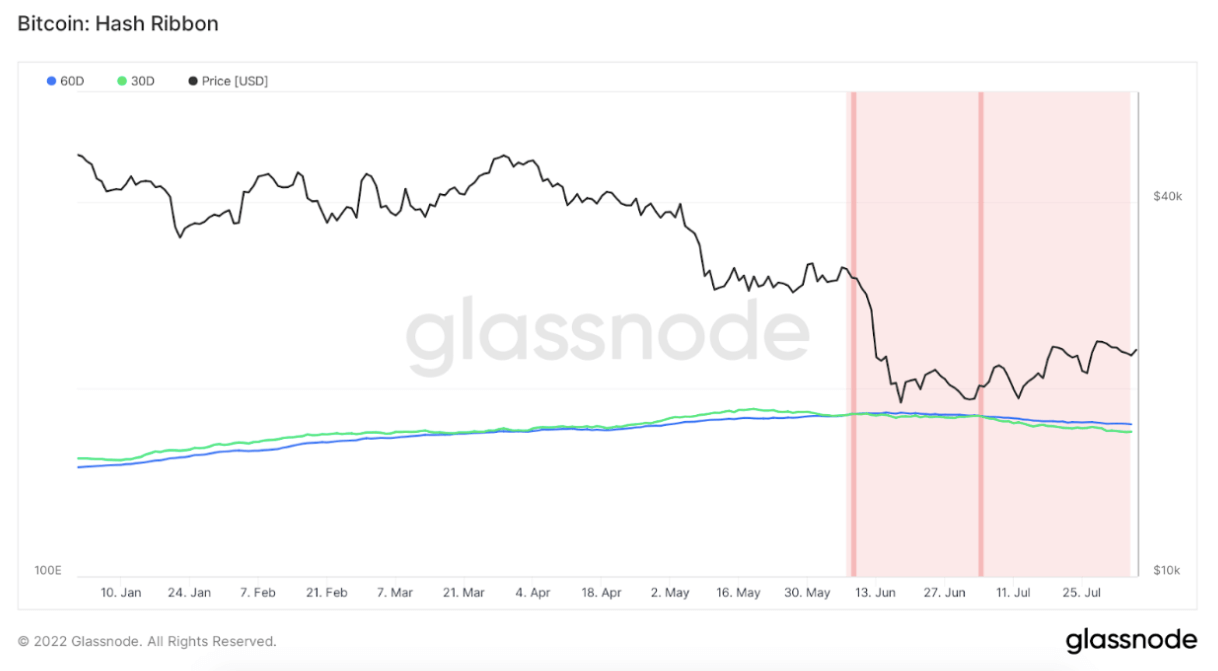
Hash ribbons are a unique metric used to determine whether the market is currently in its bear or bull phase. The indicator contains the 30-day and the 60-day simple moving average (SMA) of Bitcoin’s hash rate. The 30-day SMA dropping below the 60-day one shows the beginning of a bear market and shows miners have begun to capitulate.
Data shows that the market has been in a miner capitulation mode for almost 60 days straight. The worse of miner capitulation will be over once the 30-day SMA crosses above the 60-day SMA. However, the difference between moving averages standing still for days on end makes it hard to determine when we could see a trend reversal.

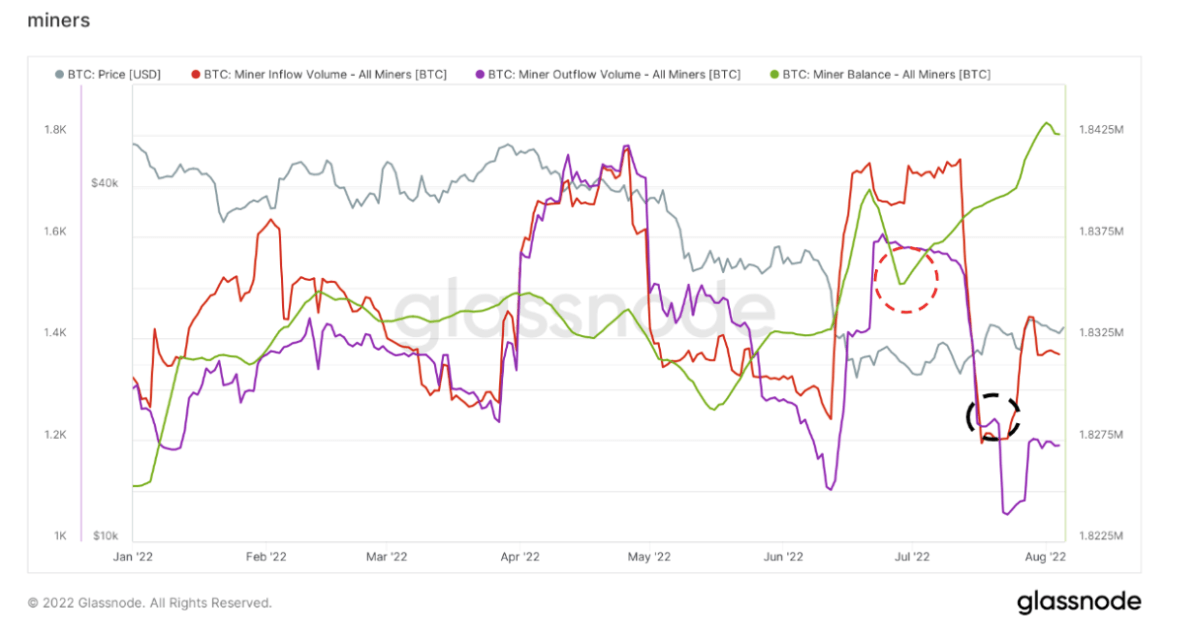
However, analyzing miner balances shows that the worst has passed, and miners have begun to recover. Miner balances look at the total supply held in addresses that belong to miners to determine whether they’ve been selling off their assets. According to data from Glassnode, miner balances recovered from the lows they reached in June and are the highest they’ve been since October 2017 (highlighted in red).
Alongside balances recovering, we’ve also seen miner outflows from exchanges briefly surpass inflows to exchange addresses (highlighted in black). This shows that more miners have been withdrawing their BTC from exchanges than they’ve been depositing it to sell on the market.

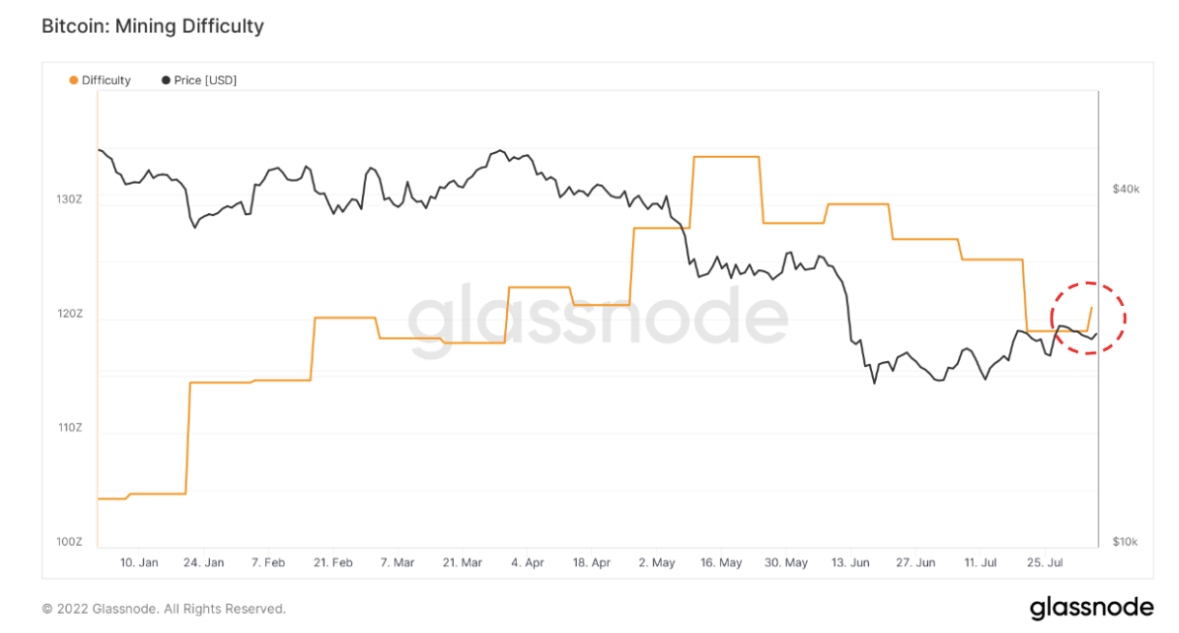
The difficulty adjustment also shows that Bitcoin could have reached its bottom. Defined as the current estimated number of hashes required to mine a block, the difficulty adjustment increased for the first time since June, rising by 1.7%. The increase shows that the Bitcoin mining difficulty could have bottomed at the beginning of August. If Bitcoin can continue holding its price alongside the $23,000 resistance, we might not revisit these mining difficulty lows any time soon.

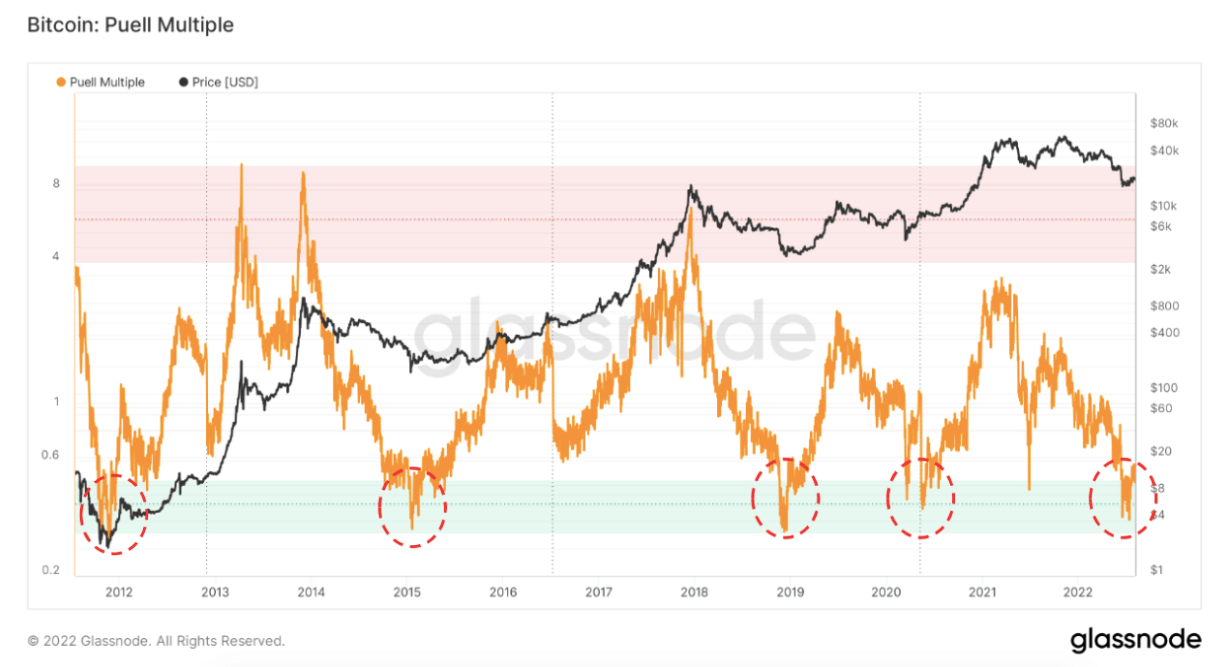
Lastly, another reliable indicator of market bottoms also seems to be flashing red. The Puell Multiple is an indicator used to determine mining probability by calculating the ratio of daily coin issuance in USD and the 365-day moving average of daily coin issuance value. When the Puell Multiple is low, it shows that miner profitability is low compared to the yearly average. When the indicator is high, miner profitability is high, and it incentivizes miners to liquidate their treasuries.
The Puell Multiple has marked previous cycle bottoms with a good degree of accuracy — it flashed bottom signals in November 2011, January 2015, November 2018, and May 2020. Data has shown that the Puell Multiple has left the green zone for the first time since June and is climbing slowly and steadily. And while the indicator has gone in and out of the green zone in previous market cycles, the outlook remains positive.

Bitcoin Market Data
At the time of press 1:23 pm UTC on Aug. 7, 2022, Bitcoin is ranked #1 by market cap and the price is down 0.39% over the past 24 hours. Bitcoin has a market capitalization of $441.48 billion with a 24-hour trading volume of $15.36 billion. Learn more about Bitcoin ›
Crypto Market Summary
At the time of press 1:23 pm UTC on Aug. 7, 2022, the total crypto market is valued at at $1.09 trillion with a 24-hour volume of $41.77 billion. Bitcoin dominance is currently at 40.35%. Learn more about the crypto market ›


