 On-chain data shows Bitcoin (BTC) whales are ‘hodling’ on as BTC nears $60,000
 On-chain data shows Bitcoin (BTC) whales are ‘hodling’ on as BTC nears $60,000
October is unravelling as a bullish month for Bitcoin (BTC), while leverage and futures premiums increase in derivatives markets.

Cover art/illustration via CryptoSlate. Image includes combined content which may include AI-generated content.
Bitcoin’s (BTC) recent constructive price action reflects upward trends in accumulation and HODLing behavior, as well as elevated on-chain activity and increased network utilization, Glassnode’s report for the first week of October revealed.
However, in sync with the positive price action, derivatives markets recorded an influx of open interest, futures premiums, and positive funding rates, which are, according to the blockchain data and intelligence provider, enhancing the likelihood of a “leverage squeeze.”
On-chain fundamentals
During the past week, the price of Bitcoin persisted within a tight consolidation range, as the crypto traded between $53,657 and $56,250.
Following a strong rally from the past month’s lows, the market succeeded to hold onto the gains, as the on-chain activity increased.
“Active Entities, the count of individual participants on-chain each day, has grown 19% to this week, reaching around 291k active entities per day. This value is on par with counts from late 2020 at the beginning of the last bull run,” read the report.

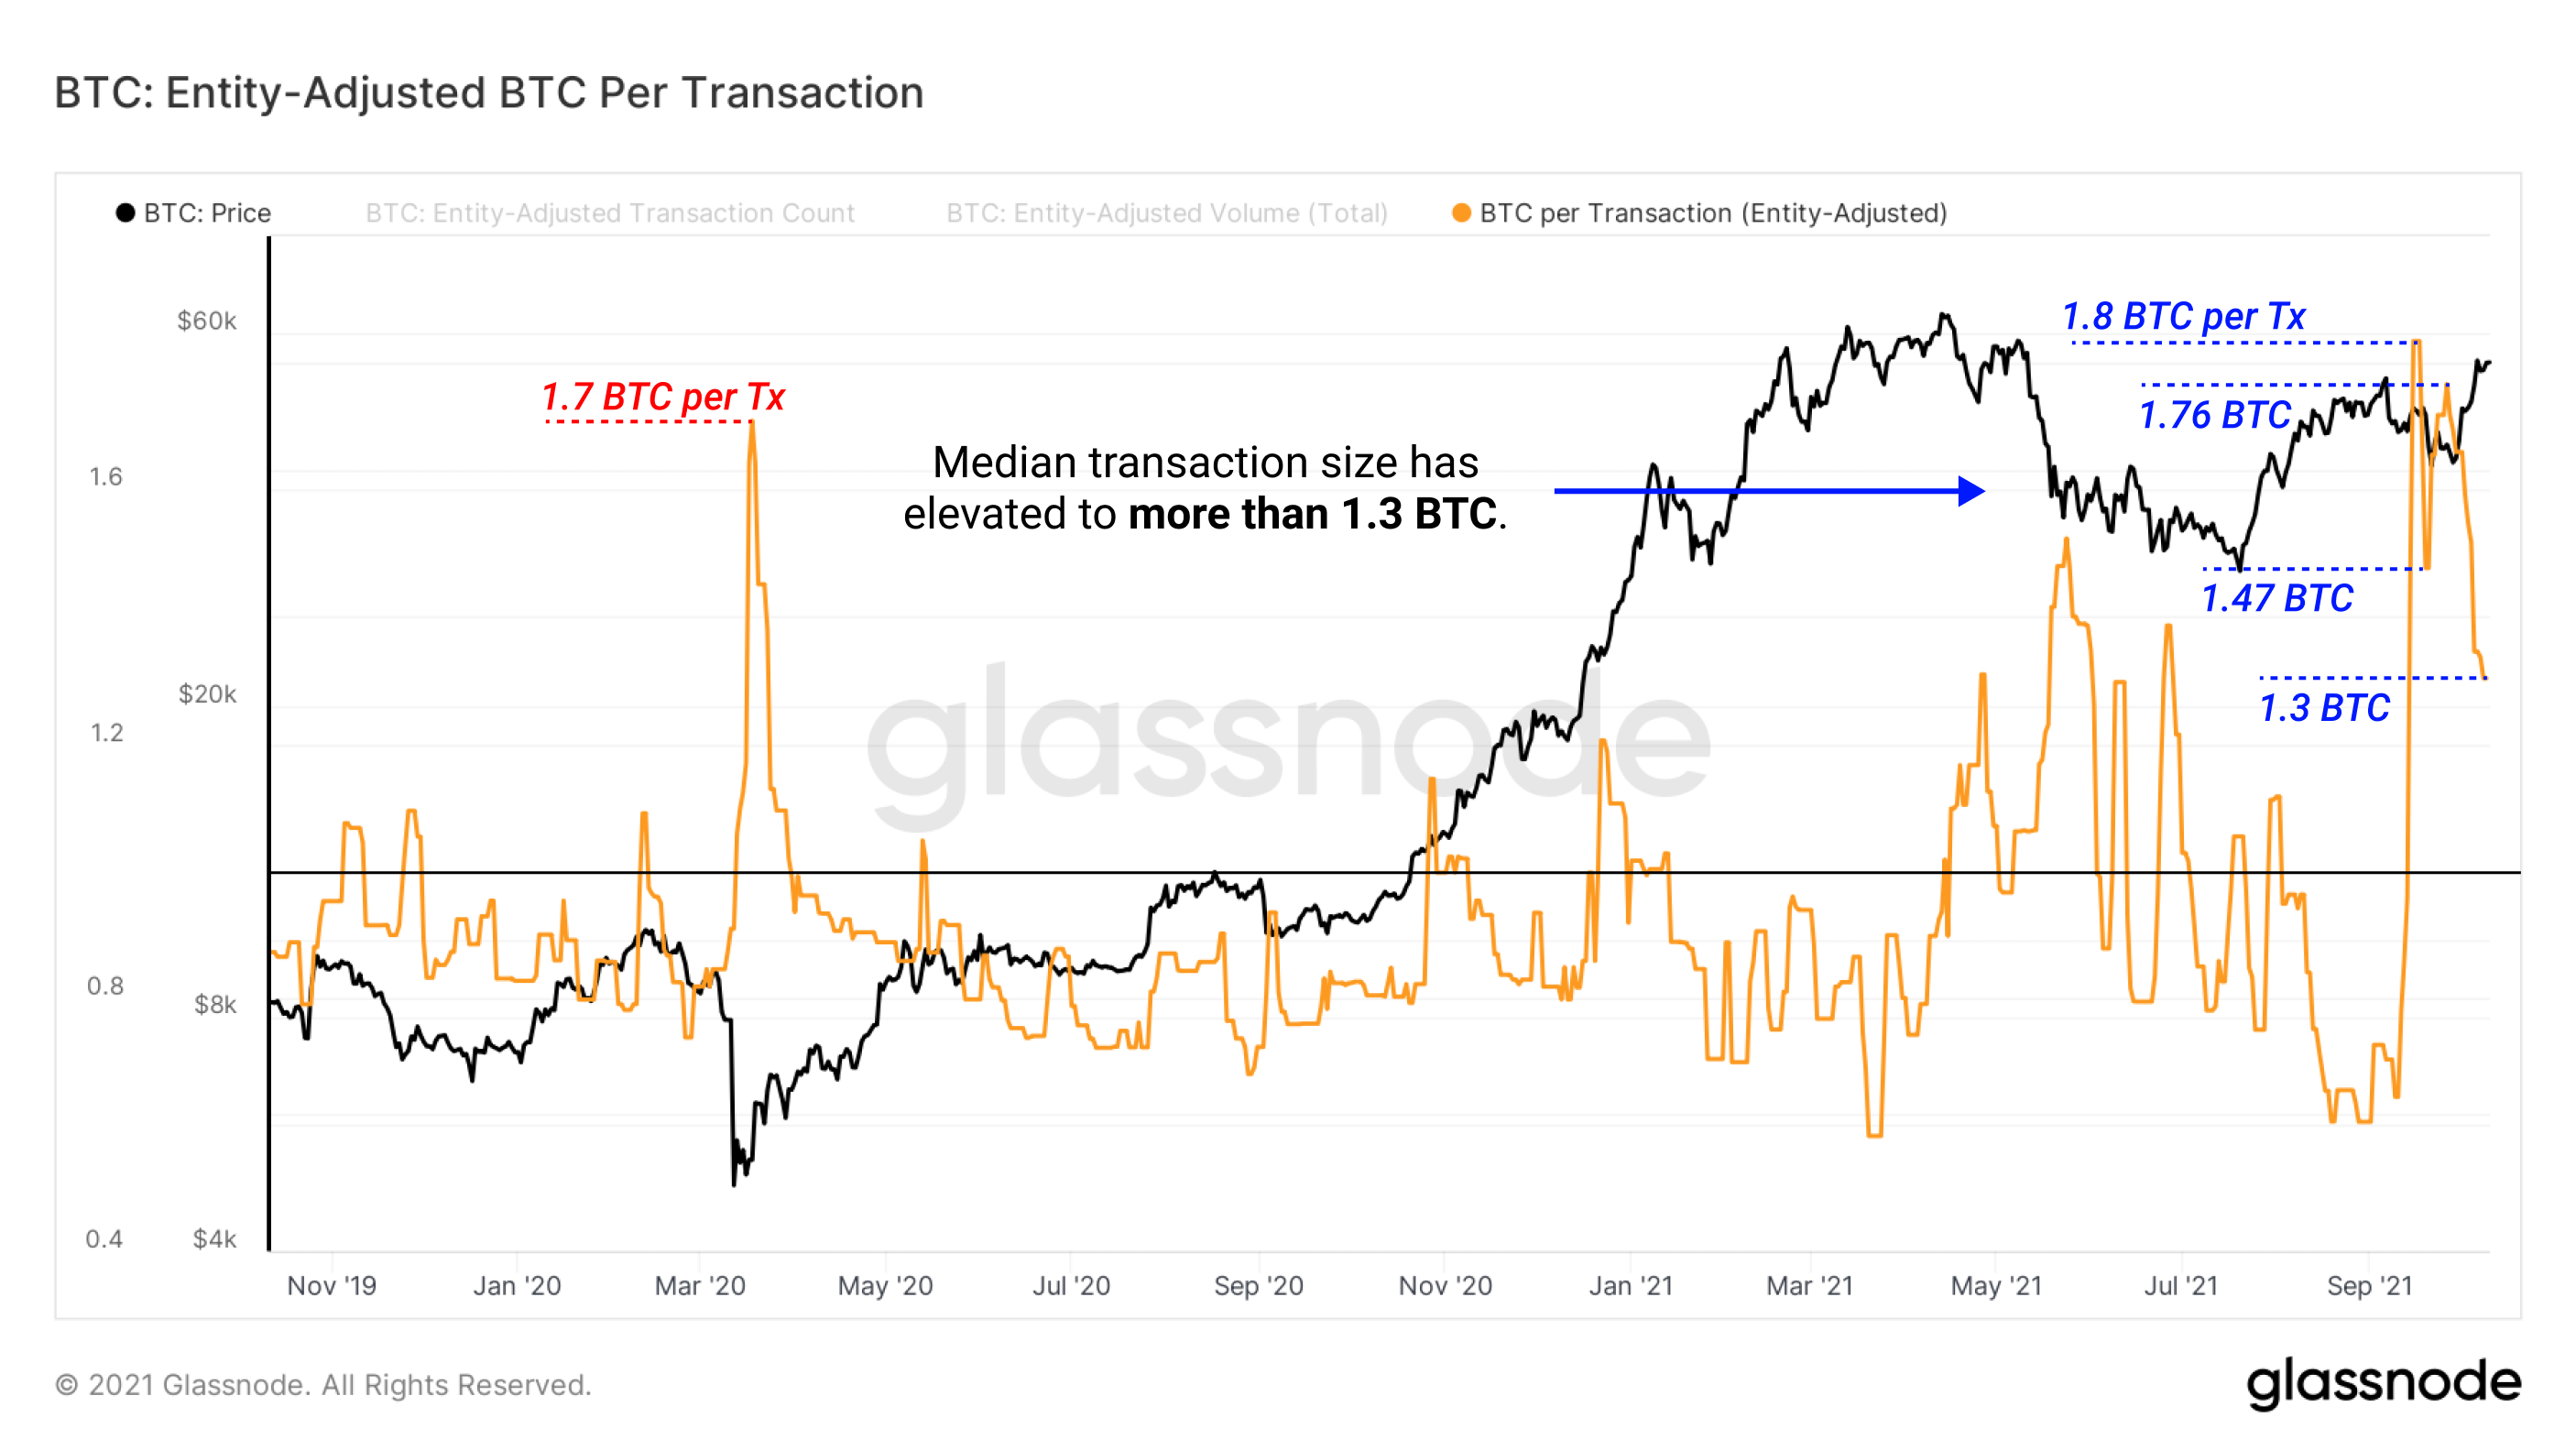
While reminding that the boosted network activity has “historically correlated with growing interest in the asset during early-stage bull markets,” the report continued to uncover that the typical coin value of transactions has also increased.
Since mid-September, the median transaction size has risen to over 1,3 BTC, according to Glassnode’s data.

“An increased typical transaction size is not synonymous with price appreciation, but indicative of larger and even institutional sized capital flows present on-chain,” the report pointed out.
In addition, the dollar value of volume moving on-chain has also increased during the past week, according to Glassnode’s data.
Transfer volume (USD) as a percentage of the realized cap broke above the 3% threshold, which is another historically bullish signal, suggesting an increase in demand for on-chain settlement of value, the report revealed.
The ratio between the two metrics “gives a sense of the level of demand volume relative to the value of the coin supply valued at the time it was last spent on-chain.”
Meanwhile, the supply held by Long-Term Holders (LTH), revealed the HODLing mentality’s strong persistence.
“Since July, LTH accumulation/HODLing has been quite consistent between 13,6 and 15,0x issuance indicating the number of coins taken out of circulation are significantly more than are being newly minted,” read the report.

Long-term holder supply to issuance ratio, which is shown in pink, representing the multiple monthly coin issuance that is being accumulated/HODLed (+ve) or distributed (-ve) by LTHs.
Derivatives markets
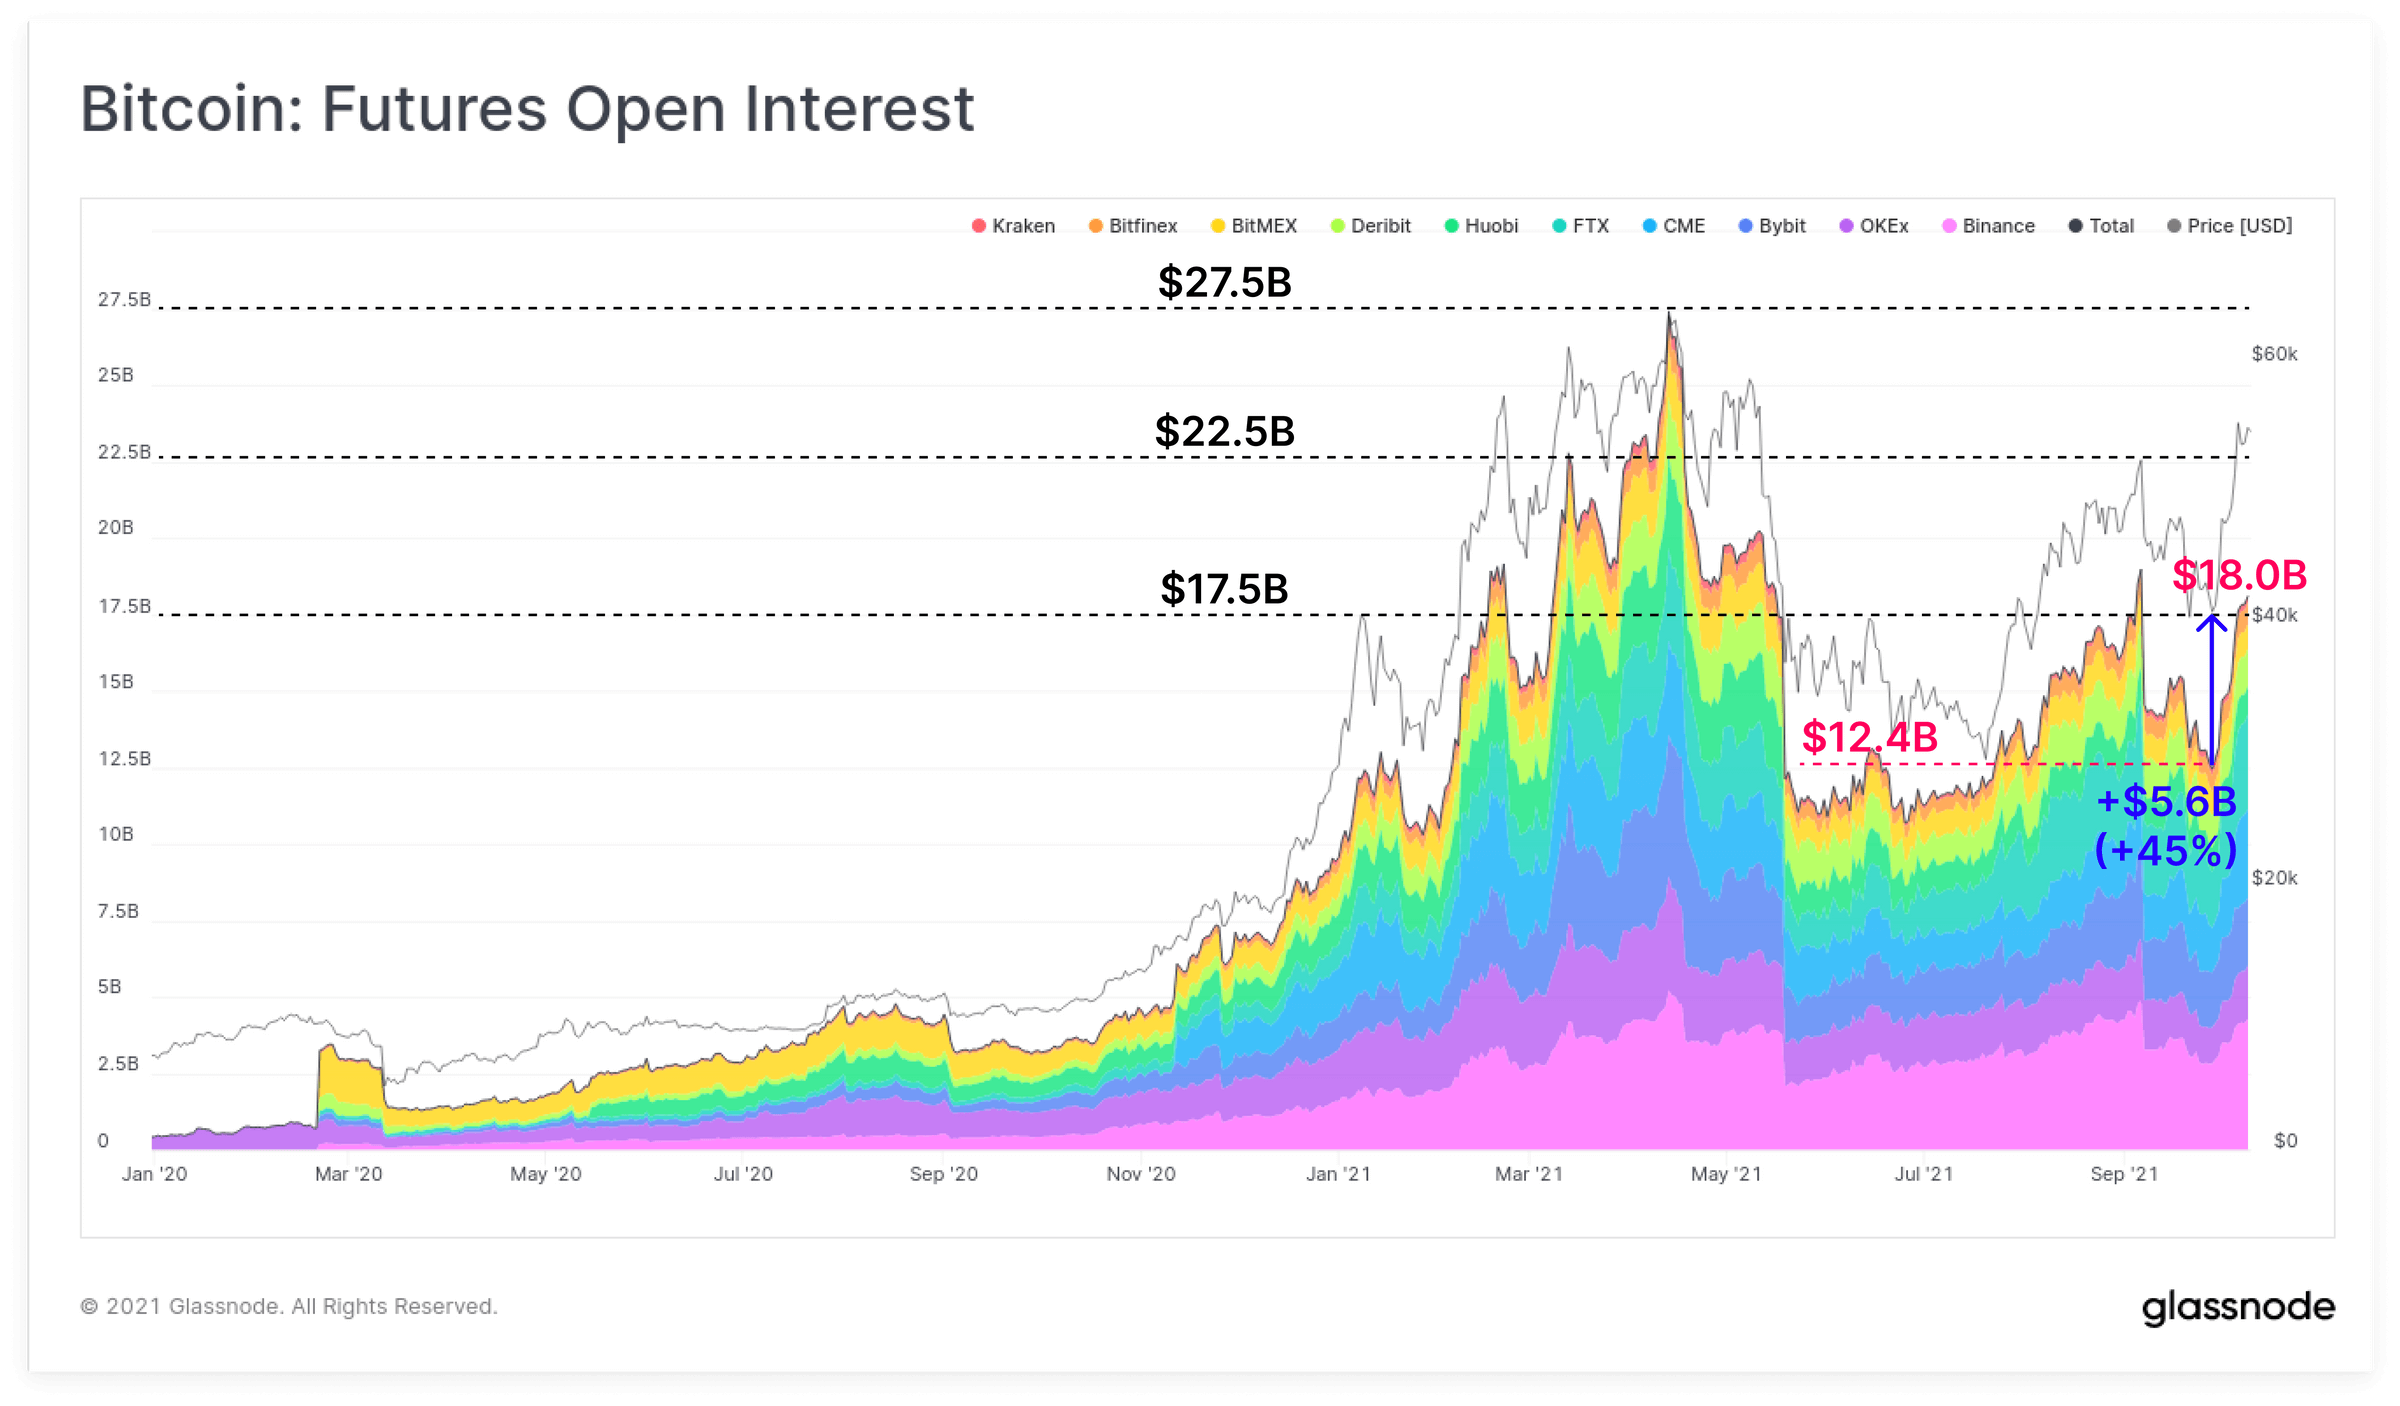
“Futures open interest has risen by $5.6 billion (+45%) since the lows in September,” read the report, underscoring that “this magnitude of open interest is similar to that in early September, and in mid-May, both of which preceded significant long squeezes.”

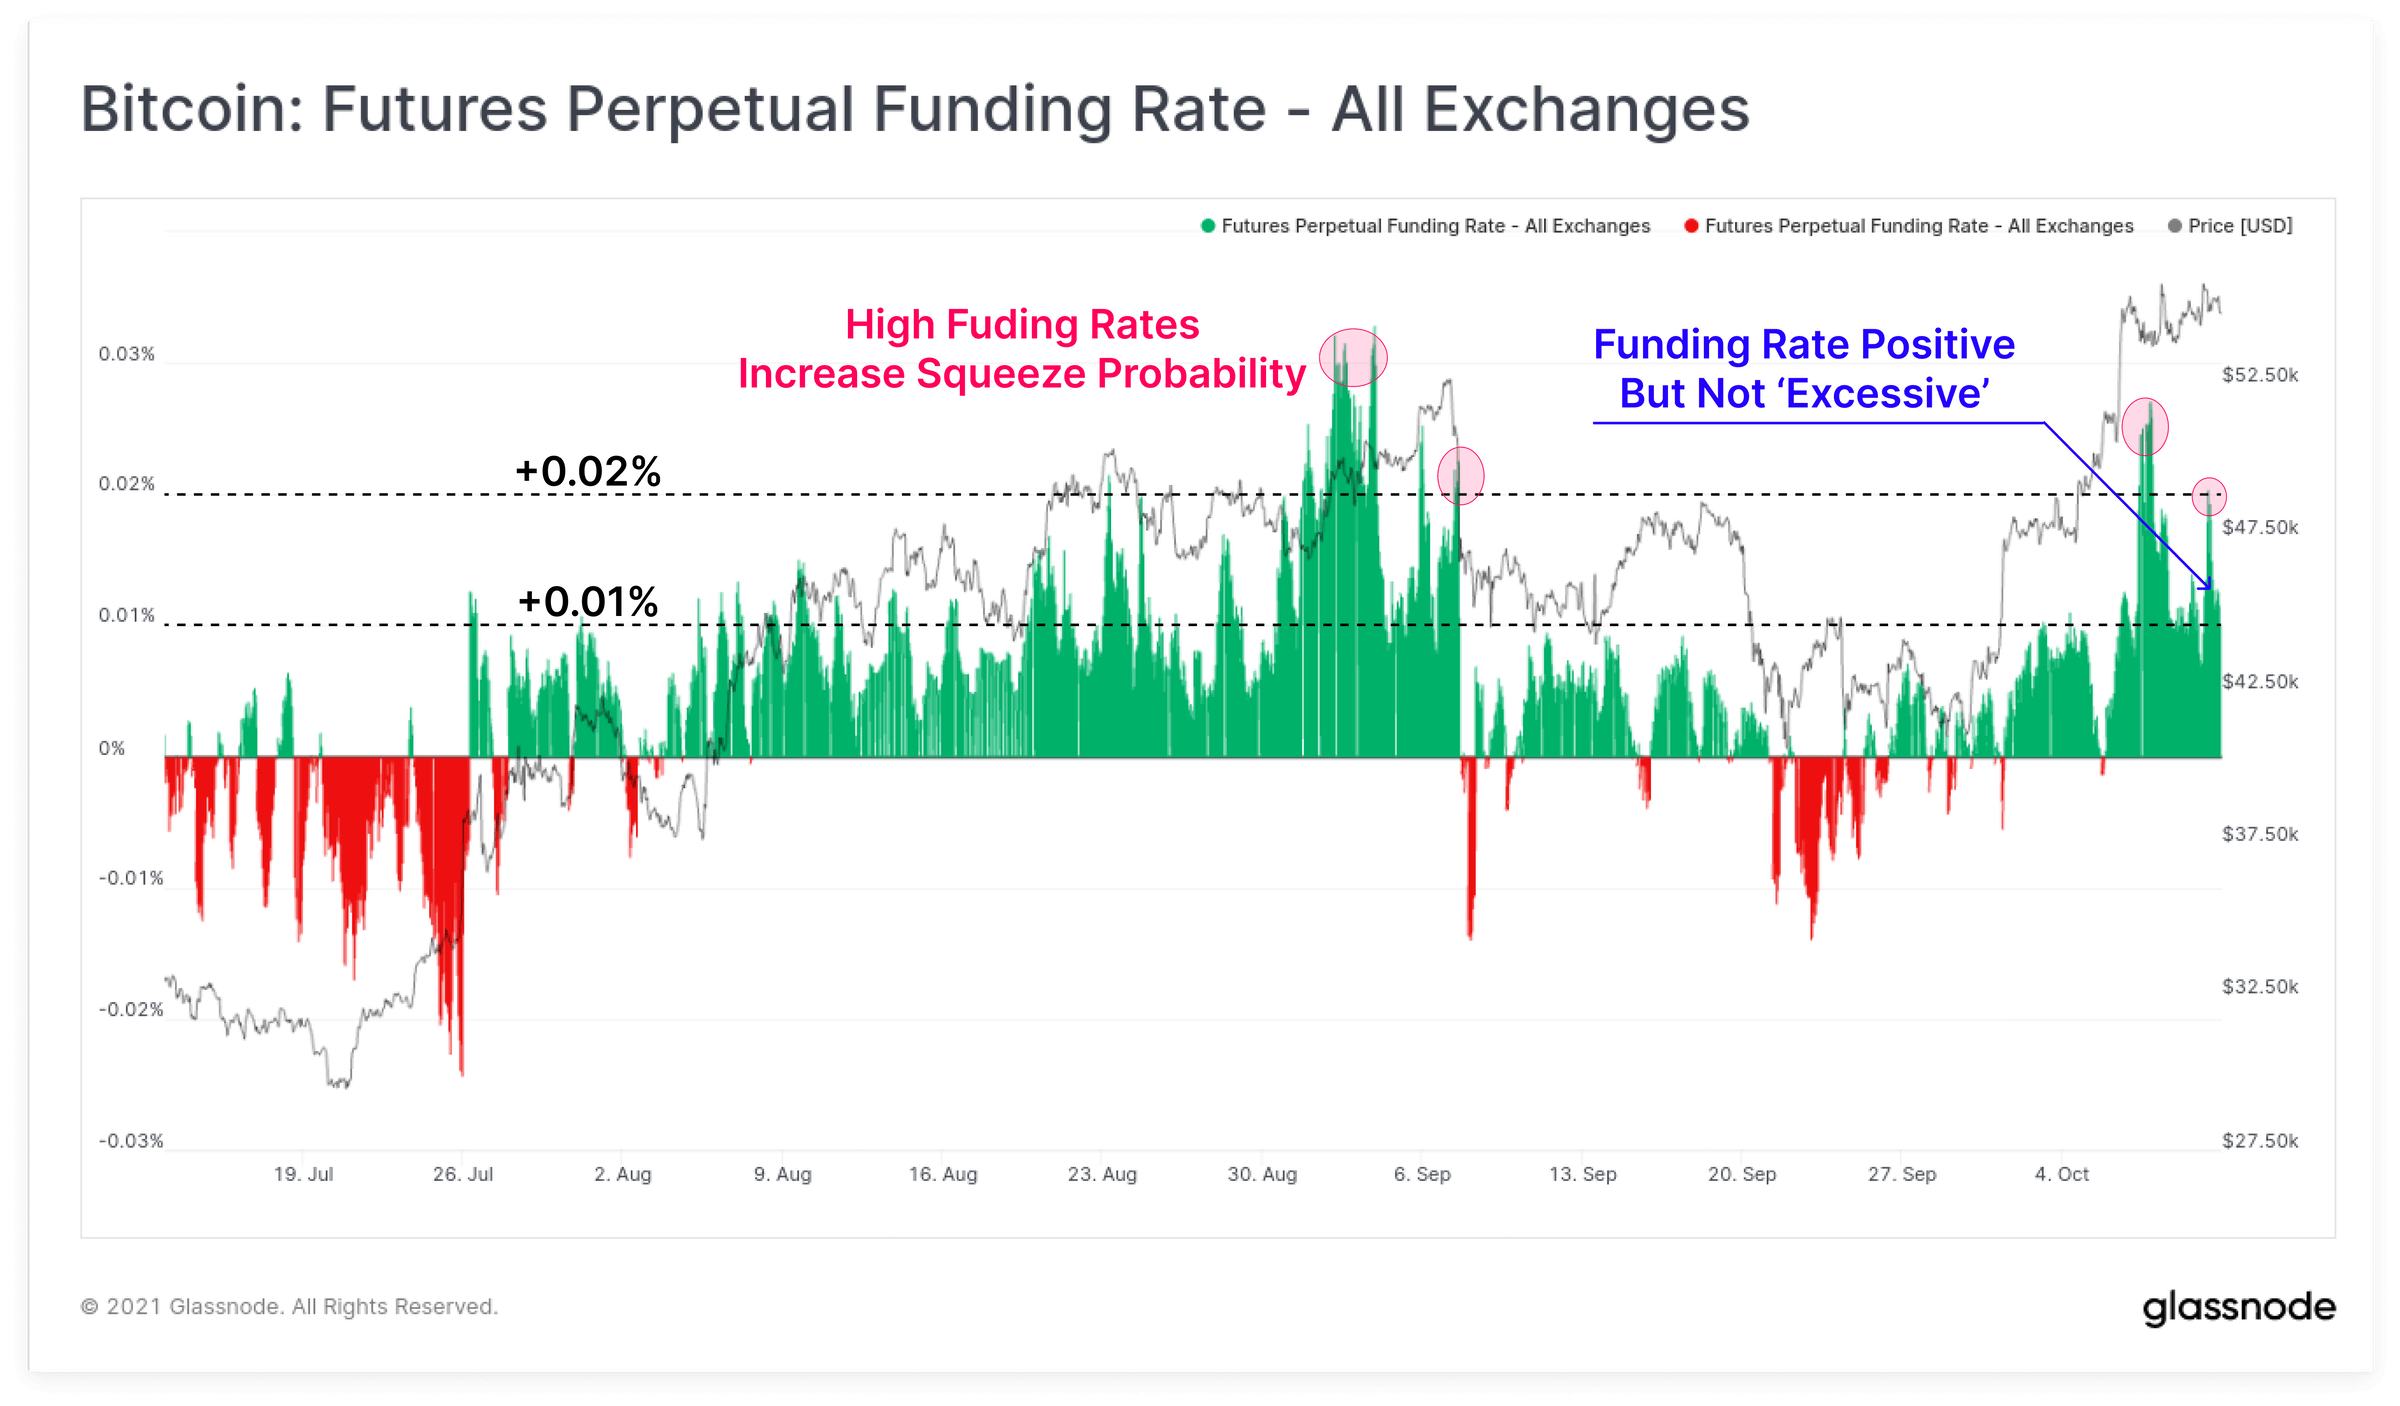
“Perpetual swap markets are also growing increasingly bullish over the last week, with funding rates trading between +0,01% and +0,02% across all exchanges,” added the report, while noting another trend to pay attention to, since “the probability of short-term volatility led by a long squeeze does increase alongside elevated funding rates and climbing open interest.


