 Key data takeaways from Chainlink’s rally to a new all-time high above $8
 Key data takeaways from Chainlink’s rally to a new all-time high above $8

Photo by Eliza Diamond on Unsplash
Chainlink (LINK) has been on an absolute tear over the past few months. From its March capitulation lows, the asset has gained in excess of 400 percent as the cryptocurrency has gained popularity over strong partnerships and an extremely strong fan base.
Behind this rally, though, is strong on-chain fundamental data that may lend to the sentiment that the altcoin has room to move even higher.
A strong on-chain and data case for Chainlink
Although some metrics can be gamed, three top blockchain analytics firms Glassnode, Santiment, and IntoTheBlock suggest that the data case for Chainlink is stronger than ever.
On the day LINK almost passed $9 for the first time ever, IntoTheBlock shared that three of the asset’s on-chain metrics were at all-time highs. These metrics were the number of active addresses, the number of addresses created, and the number of on-chain transactions.
#Chainlink is on fire?, as the price is up 39% during the last 7-days
July 14 was a milestone day for the #LINK token because:
– 14.26k addresses were active (highest # ever)↗️
– 6.51k new addresses were created (highest # ever) ↗️
– 22.8k on-chain transactions (highest # ever) pic.twitter.com/lMsJ7g0shc— intotheblock (@intotheblock) July 15, 2020
IntoTheBlock’s chief scientist Jesus Rodriguez added in a separate report that the number of “large” Chainlink transactions (meaning in excess of $100,000 worth of value changing hands) has increased by 1,500 percent in three months.
Santiment and Glassnode, too, have taken note of the surge in some of the cryptocurrency’s core metrics.
Expect a pullback for LINK
Crypto analyst Josh Olszewicz is warning of a bearish reversal in the price of LINK, despite the strong on-chain data.
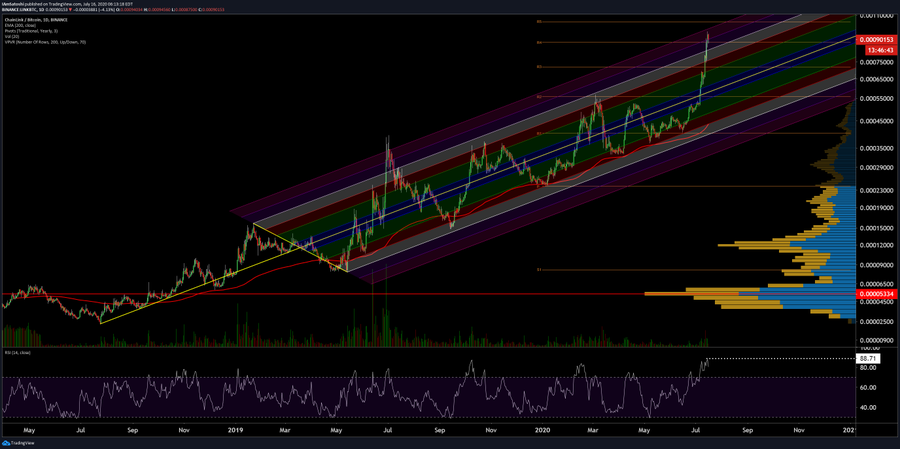
Sharing the chart below of the ratio between Chainlink and Bitcoin (LINK/BTC) on Jul. 16, he wrote: “I don’t want to be THAT GUY but LINK might be overbought here.” Backing this assertion, he pointed to four technical signs:
- The pair’s relative strength index (RSI) is at an all-time high, with the oscillator almost reaching 90. This is a textbook signal that the asset is alm0st extremely overbought.
- LINK is nearing the “R5 Yearly Pivot Resistance.” The asset previously found it difficult to break lower yearly pivots.
- LINK has reached the top of a pitchfork extension pattern. The last time the asset encountered this technical level, it briefly spiked before seeing a correction towards the bottom of the channel.
- A bearish divergence has formed between LINK’s price and the RSI on the 12-hour chart.

This has been echoed by another trader, who noted that LINK’s market volume and candlesticks read like a “blow-off-top” may be taking place.
The true test of Chainlink’s rally, then, is likely to be how its on-chain fundamentals will perform when (or if) the correction comes.
Chainlink Market Data
At the time of press 11:18 pm UTC on Jul. 17, 2020, Chainlink is ranked #8 by market cap and the price is down 1.41% over the past 24 hours. Chainlink has a market capitalization of $2.9 billion with a 24-hour trading volume of $718.4 million. Learn more about Chainlink ›
Crypto Market Summary
At the time of press 11:18 pm UTC on Jul. 17, 2020, the total crypto market is valued at at $270.23 billion with a 24-hour volume of $50.05 billion. Bitcoin dominance is currently at 62.33%. Learn more about the crypto market ›


