Explore CryptoSlate’s Institutional Playbook, a 3-part guide series on exchange due diligence, crypto-as-a-service, and token listing strategy for institutional teams.
Explore CryptoSlate’s Institutional Playbook, a 3-part guide series on exchange due diligence, crypto-as-a-service, and token listing strategy for institutional teams.
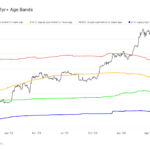
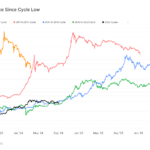
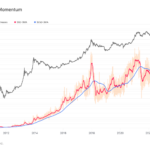
DEFINITION: This chart displays an overlay of multiple Supply Last Active variants, each shown as a percentage of Circulating Supply.
Supply Last Active 1+ Yrs Ago 🔴
Supply Last Active 2+ Yrs Ago 🟠
Supply Last Active 3+ Yrs Ago 🟢
Supply Last Active 5+ Yrs Ago 🔵
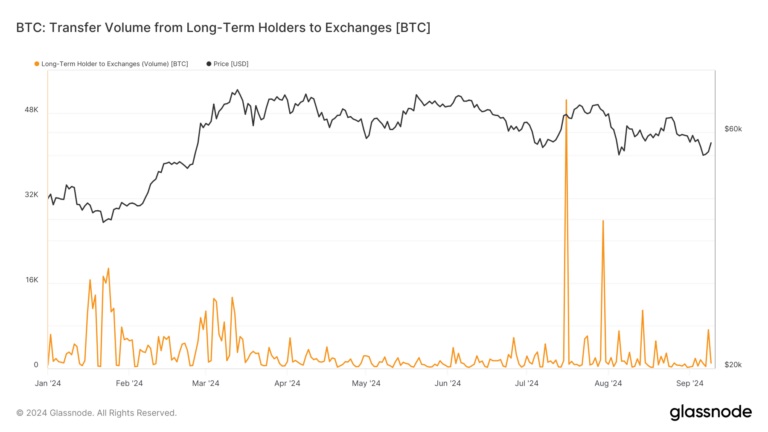
Bitcoin's supply, which was active over one year ago, has recently shown signs of decreasing, suggesting a shift in long-term holder behavior. The first chart illustrates a subtle but notable decline in the percentage of Bitcoin unmoved for over one year, dipping from its peak earlier in 2024. This trend hints at a potential increase in selling pressure from longer-term holders.
BTC Supply Last Active 1yr+ : (Source: Glassnode)
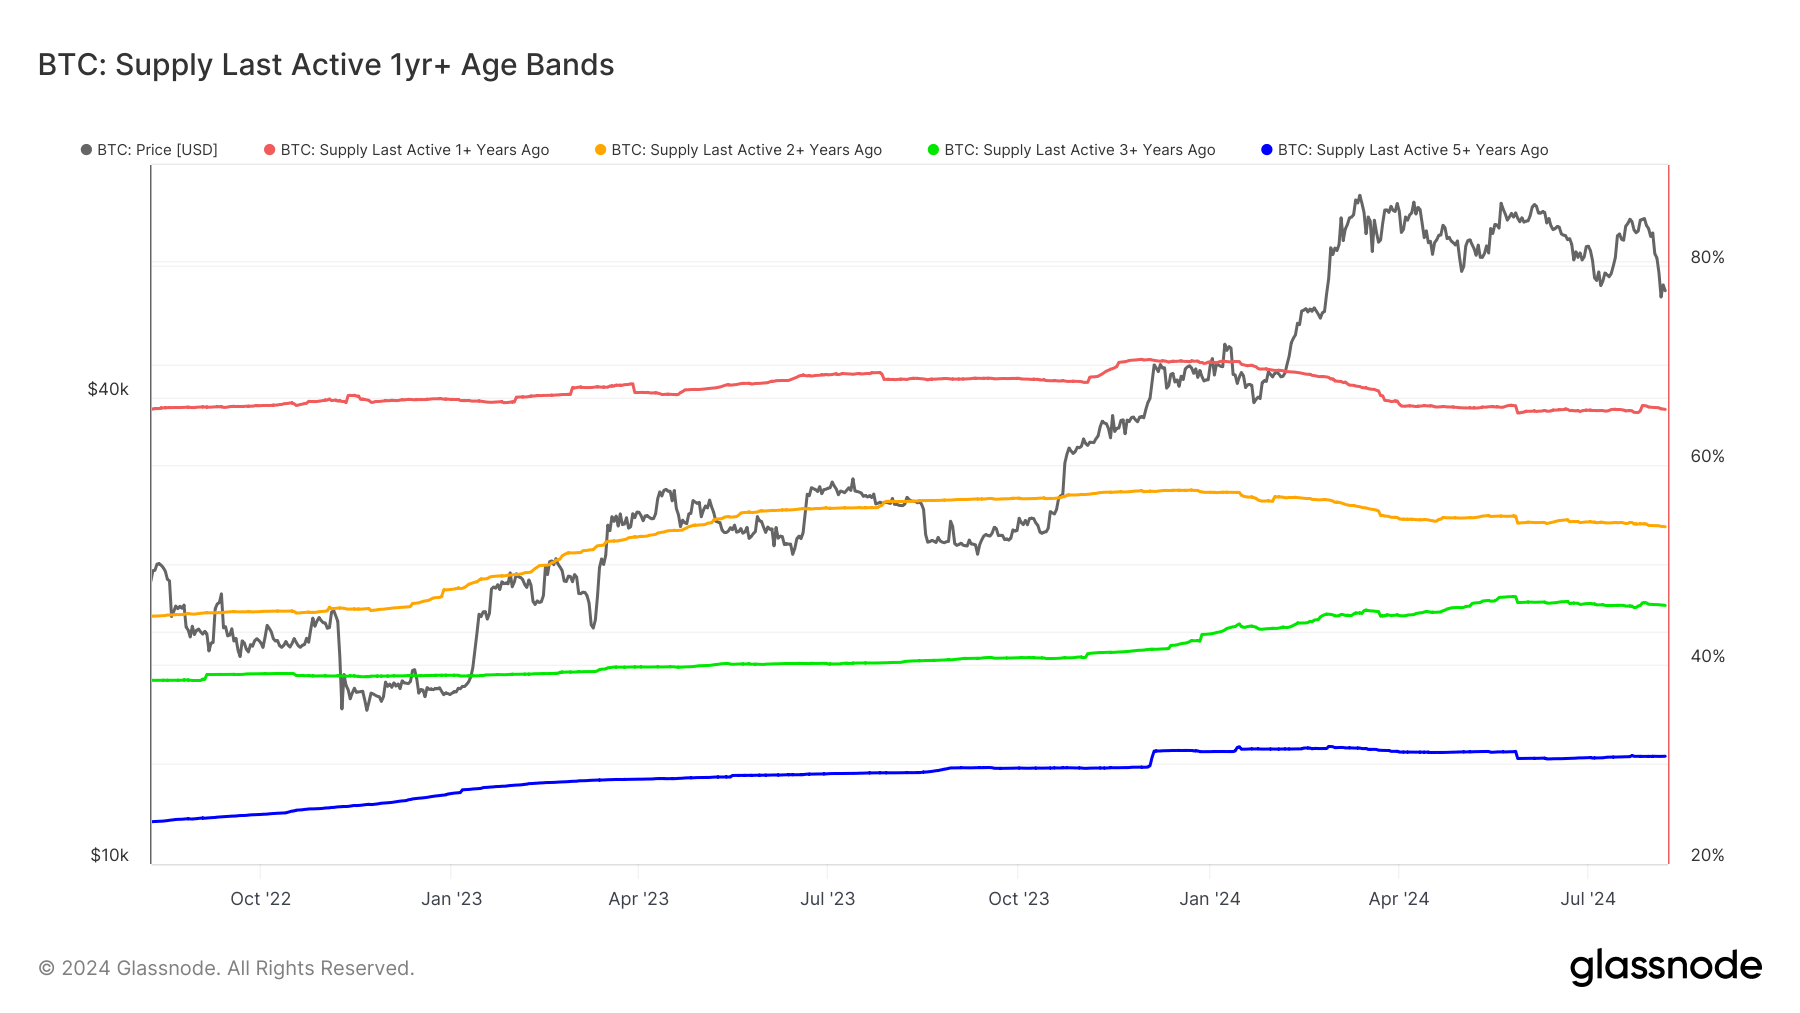
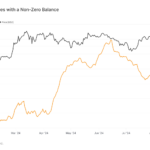
The second chart provides a broader historical context, highlighting that despite the recent declines, these age bands have generally trended upward over the years. Periodic decreases in these bands have historically aligned with major market cycles, where long-term holders reduce their positions, leading into bull market tops. This recent decline contrasts with the more sustained increases seen since 2013.