 Is $58k the new $9k for Bitcoin?
 Quick Take
Samson Mow recently stirred discussion on X by declaring that “$58k is the new $9k” for Bitcoin. Intrigued by this bold statement, we decided to put Mow’s theory to the test by examining Bitcoin’s trading patterns, especially in light of its historical price behavior.
Since reaching its all-time high of approximately $73,000 in March, Bitcoin hasn’t seen much price volatility, dipping to a low of around $49,000 on Aug. 5. Coincidentally, this was roughly the same price as when the Bitcoin ETF launched in January.
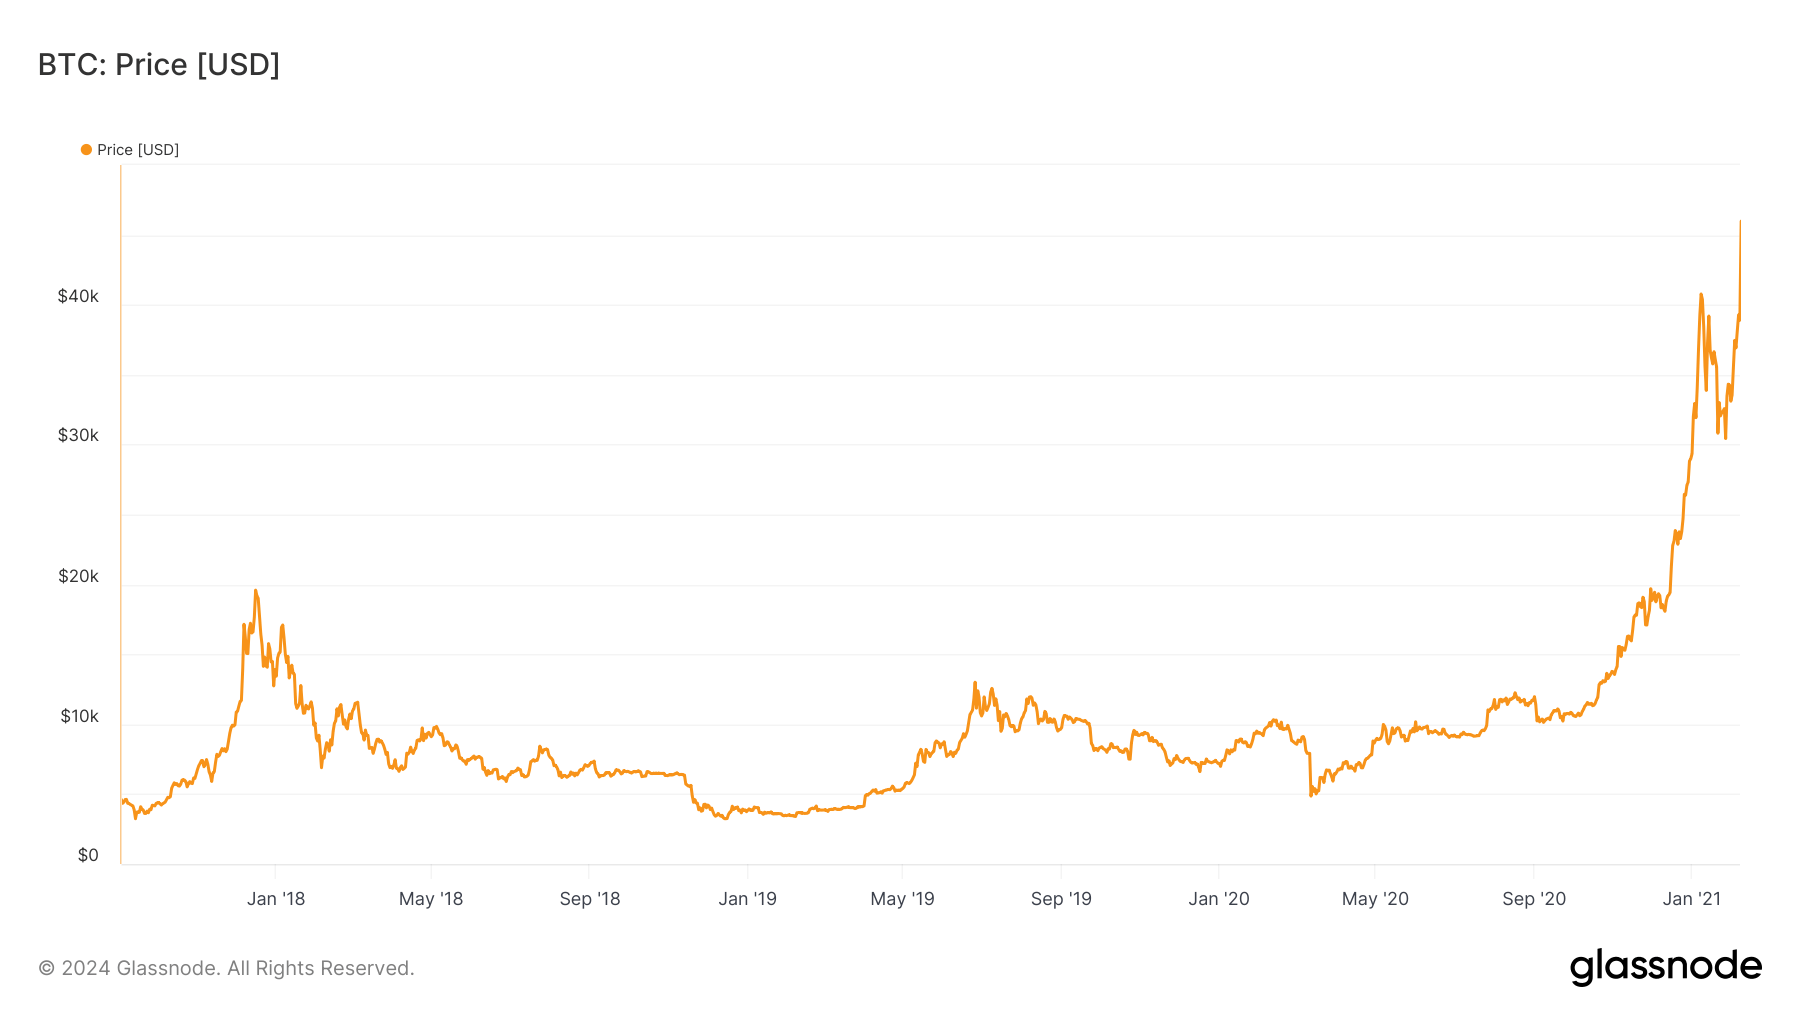
Despite this volatility, Bitcoin has predominantly traded within the $60,000 range, occasionally spiking to $70,000 before retreating. This pattern draws parallels to the 2020 cycle, when Bitcoin spent a prolonged period of around $9,000 from June 2019 to September 2020. Even during the COVID-19 crash, when Bitcoin briefly plummeted to $4,000, it quickly returned to the $9,000 range.

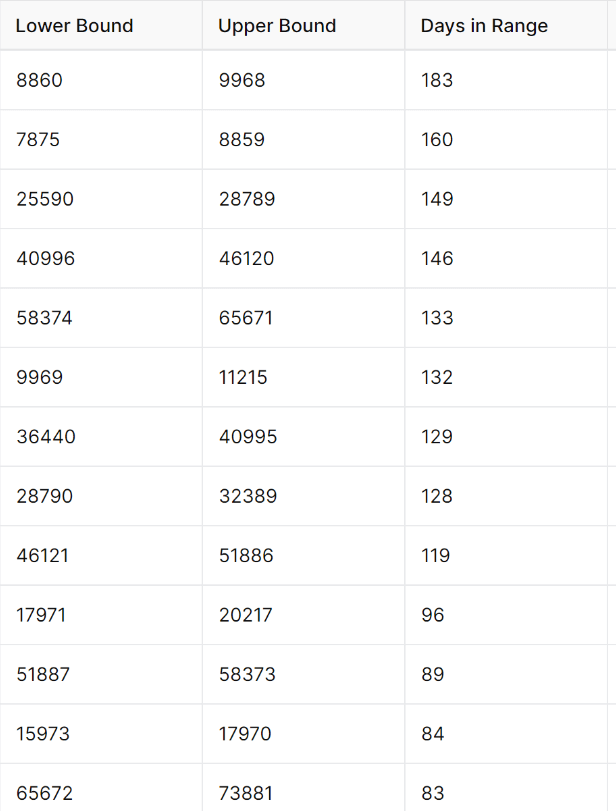
We rigorously analyzed these trends using roughly a 12% price range. This approach allows for a fair comparison across different price levels by maintaining a consistent percentage range rather than a fixed dollar amount.
Our findings revealed that Bitcoin spent 183 days in the range of $8,860 to $9,968 and 160 days between $7,875 and $8,859. Currently, Bitcoin has spent 133 days trading between $58,374 and $65,671.
With 50 days until Oct. 9, the start of the fourth quarter — a traditionally bullish period for Bitcoin — market observers are keen to see if history will repeat itself and validate Mow’s assertion.


