DEFINITION: The 200 Day Simple Moving Average is a common technical indicator in Technical Analysis, commonly associated with the transition point between a Bull and Bear market.
Bitcoin price movements are influenced by various technical models that provide insight into market trends and potential future performance.
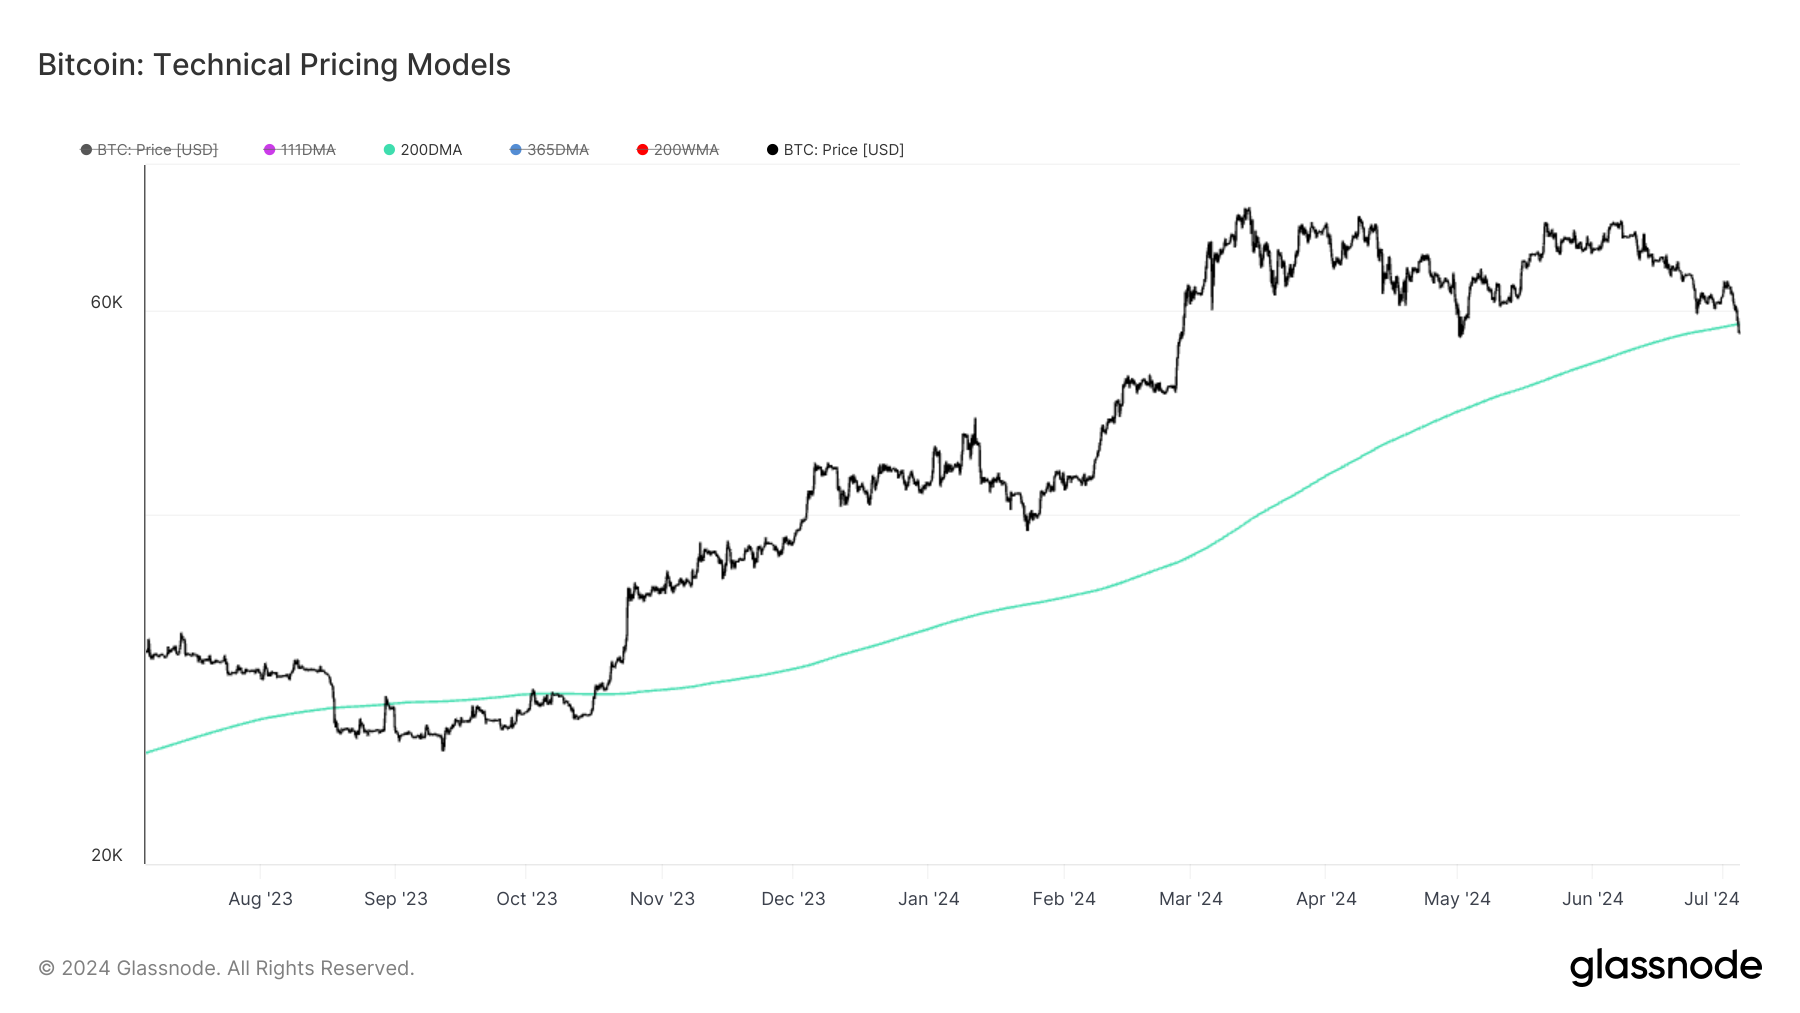
As of July 4, Bitcoin has fallen below the 200-day moving average (DMA), which is currently at $58,373. The last time Bitcoin fell through this level was in August 2023.
200 Day Moving Average vs BTC: (Source: Glassnode)
Since the beginning of 2024, Bitcoin's price has shown a robust upward trajectory, peaking above $70,000 in March. The chart below illustrates Bitcoin's price repeatedly testing and, at times, dropping below the 200 DMA, indicating periods of market correction.
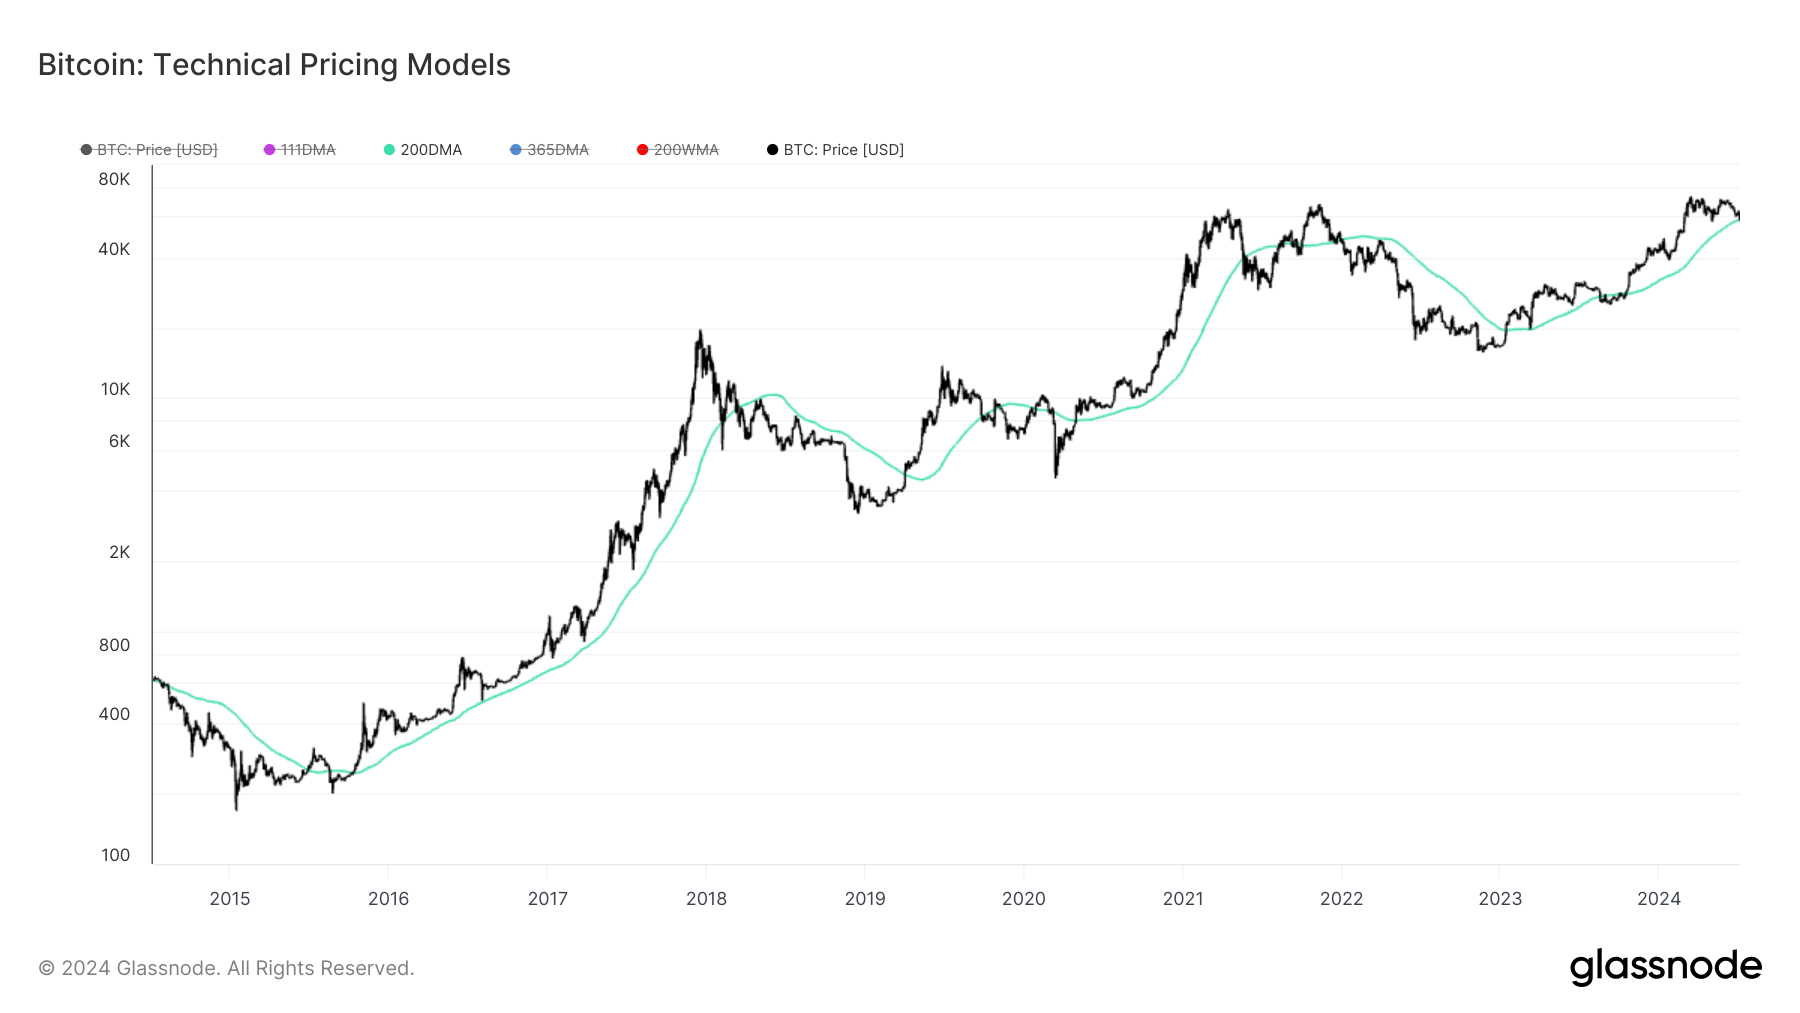
200 Day Moving Average vs BTC: (Source: Glassnode)
Historically, Bitcoin's interaction with the 200 DMA has served as a reliable indicator of bullish or bearish trends. The long-term chart from 2014 to 2024 demonstrates multiple instances where the price crossing above the 200 DMA has preceded significant upward momentum, while crossings below often signal extended bearish phases.
Current price action around the 200 DMA suggests caution as Bitcoin's market dynamics adjust post-halving, potentially signaling the end of the recent bullish cycle.